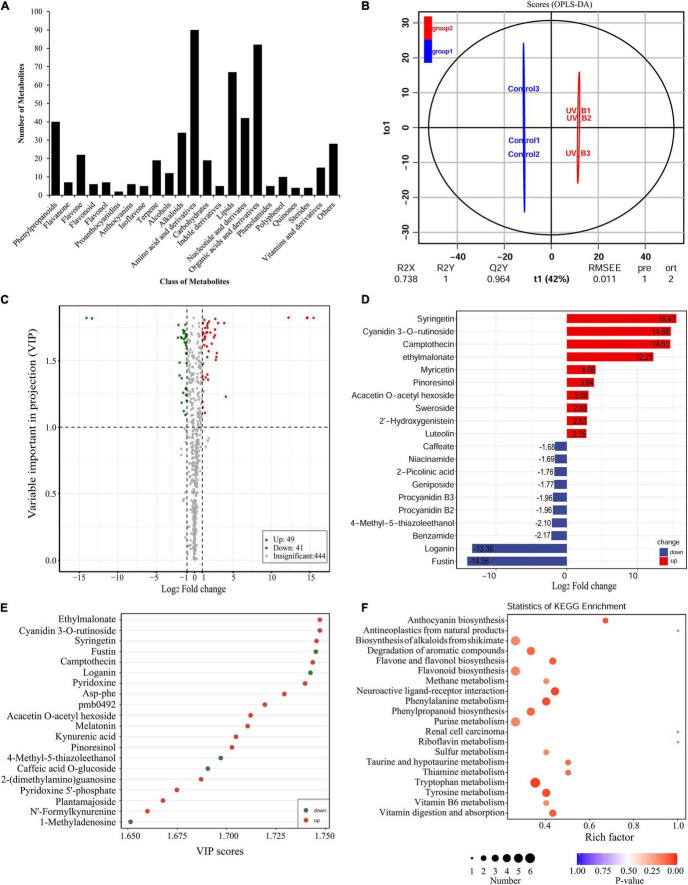
FIGURE 6.
Widely targeted metabolomic analysis of the Antarctic moss under UV-B radiation. (A) Statistical analysis of the classes of total metabolites. (B) The differences between UV-B radiation group and control group were calculated using OPLS-DA model. R2X and R2Y indicate the interpretation rate of X and Y matrix, respectively. Q2Y represents the prediction ability of the model. A value closer to 1 means that the model is more stable and reliable. In addition, Q2Y > 0.5 can be regarded as an effective model, and Q2Y > 0.9 is an excellent model. (C) The volcano plot showing the contents of metabolites and the statistical significance. Each point represents a metabolite. Horizontal ordinate indicates the fold change of metabolites between two groups, while VIP value represents significant difference in statistical analysis. (D) The fold change of the top 20 significantly changed metabolites (SCMs) between two groups. (E) The VIP scores of the top 20 SCMs between two groups. (F) Statistics of KEGG enrichment for the SCMs.

