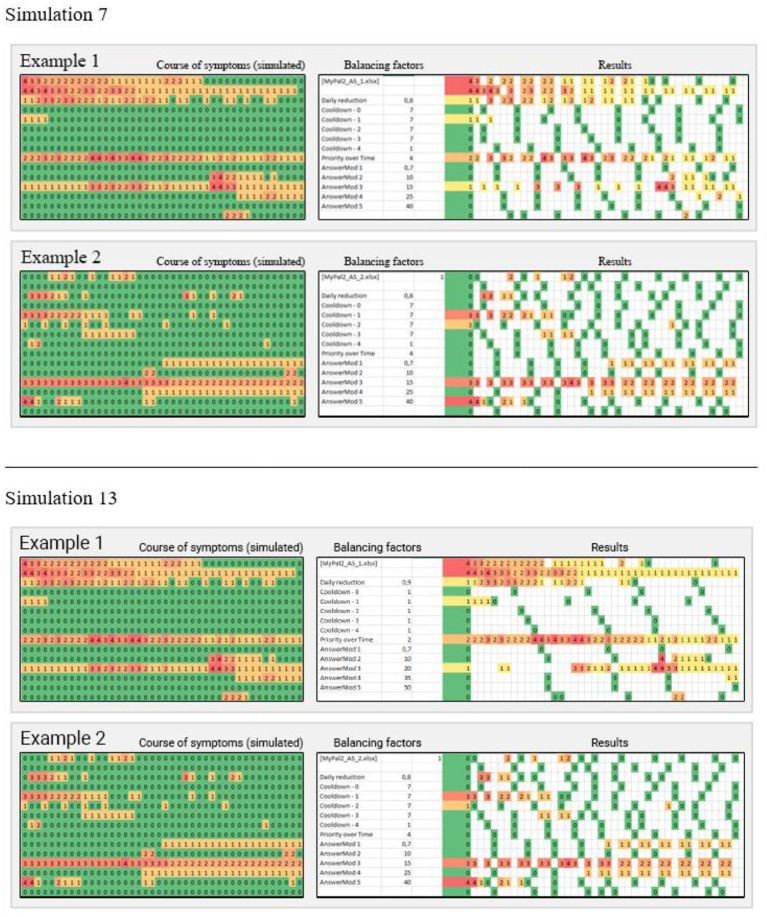
Figure 10.
The patterns on the left show a simulated course of symptoms over 14 days, defined by clinicians. In the center are the balancing factors described in the “Questions Prioritization Scheme” section. To the right are the resulting sample patterns, assuming the app is used three times a day. Three columns represent 1 day (morning, noon, and evening).

