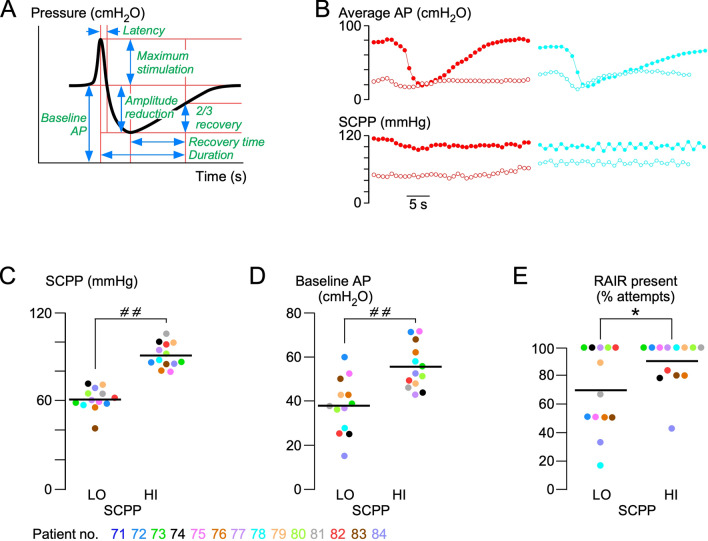
Fig. 3.
Effect of SCPP on the RAIR. a Schematic showing characteristics of the RAIR signal. b Typical RAIR signals from patients 82 (left) and 78 (right) at low (open circles) and high (solid circles) SCPPs. c Mean high (HI) and mean low (LO) SCPPs corresponding to the RAIR measurements for each patient. Plots showing individual patient values (points) and means (lines) at HI versus LO SCPP of mean baseline AP (d), recovery time (e), and percentage amplitude reduction of the RAIRs (f). Color codes for patients 71–84. *P < 0.05, # #P < 0.0001. AP anal pressure, RAIR recto-anal inhibitory reflex, SCPP spinal cord perfusion pressure

