
Figure 2. Expanded ER membranes, increased effective viscosity, and diminished chromosome dynamics of CTDNEP1 deleted mitotic cells.
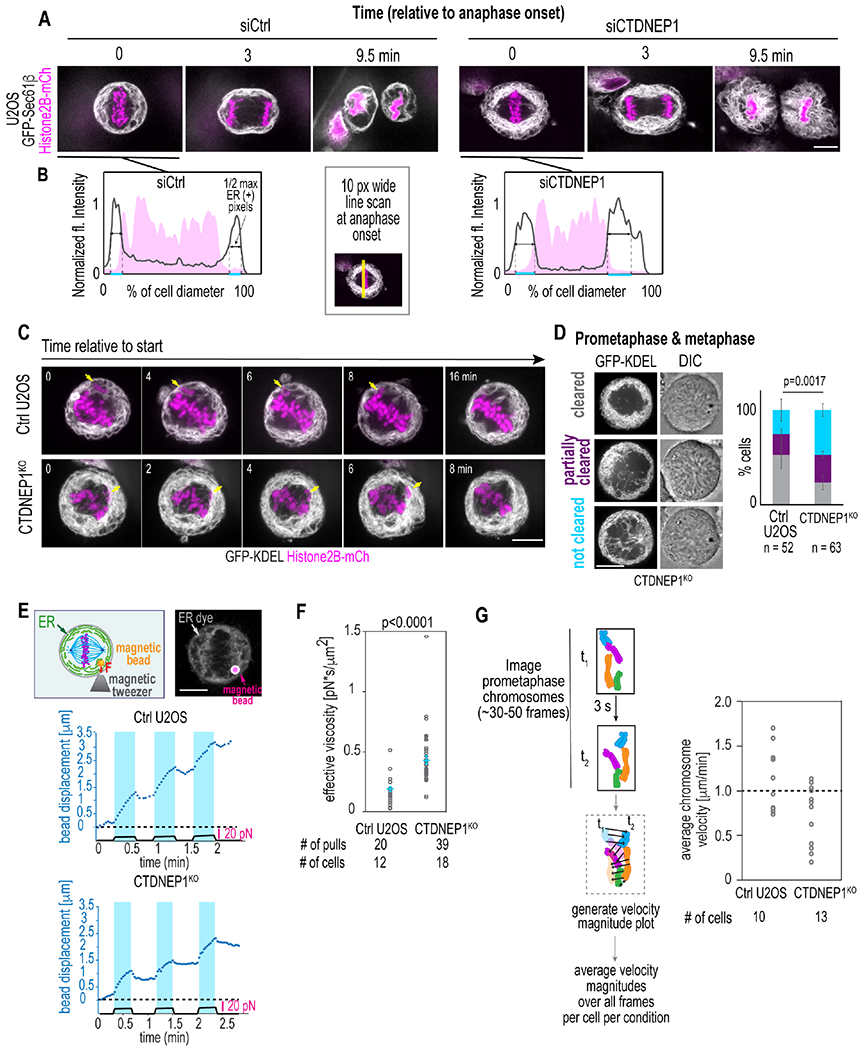
(A) Selected spinning disk confocal time lapse images in cells treated as indicated. (B) Plots, line profiles of fluorescent intensities along region shown. (C) Selected spinning disk confocal time lapse images in indicated cells after recovery from Cdk1i. Arrows, unaligned chromosomes. (D) Center plane spinning disk confocal images of mitotic cells. Plot, incidence of phenotypes. Means ± SDs shown. N = 3 experimental repeats. p value, χ2test. (E) Top: Schematic of experiment setup and confocal image of ER (gray) and magnetic bead (magenta) in a mitotic U2OS cell. Plots, applied force (black solid line) and bead displacement (blue dotted line). (F) Plot of effective cytoplasmic viscosity in indicated cells. Means ± SEM shown. p value, unpaired t test with Welch’s correction. (G) Schematic (left) for quantifying average velocity magnitudes for chromosomes for indicated cells in plot (right). Scale bars, 10 μm. See also Figure S3.