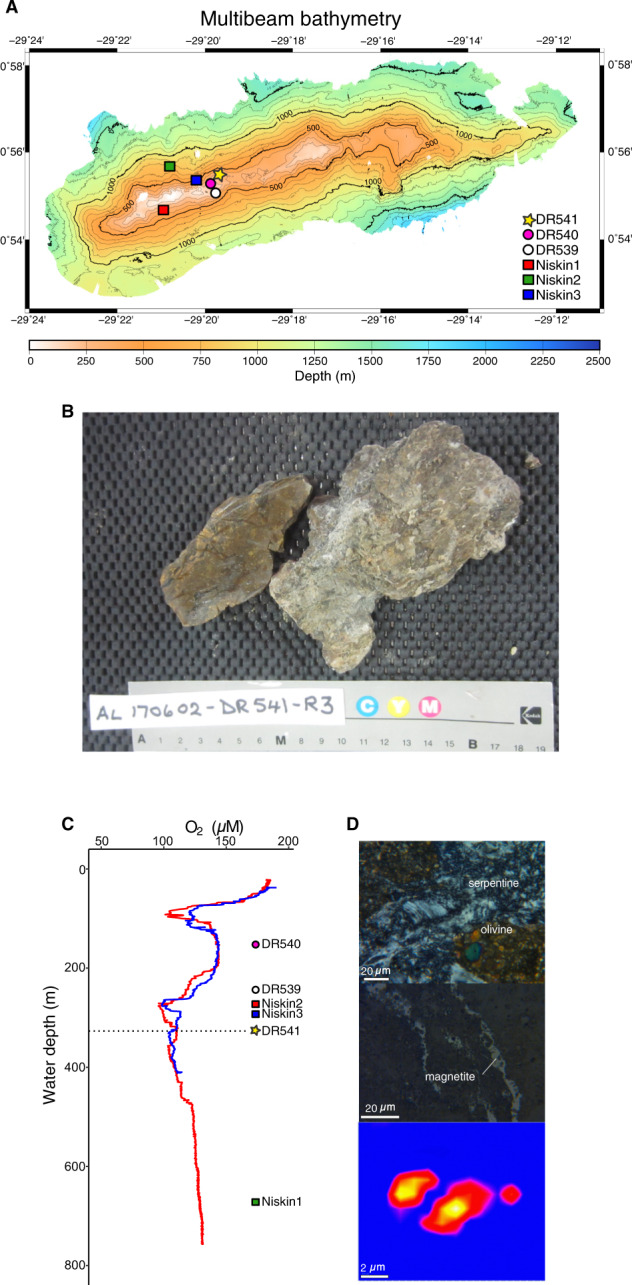
Fig. 1. Bathymetry and petrology of SPSPA.

A Bathymetry of SPSPA and sampling locations for Niskin, IGT fluids, sediments, and rocks. The location for the qSIP experiment (D541) is shown with a yellow star. B Photo of partially serpentinized peridotite collected from St. Pauls Rocks, the interior of the rock was used for the qSIP incubations. C Dissolved oxygen vertical profiles from two sites (Niskin2, Niskin3) in close proximity to the location for qSIP (D541). The horizontal dashed line represents the depth where samples were taken for qSIP (327 meters). The other labels indicate the water depths at which those samples were taken (see map in panel A). D Thin section photomicrographs of sheared peridotite from SPSPA. The presence of serpentine and magnetite (top two panels) is indicative of H2 generation. Hyperspectral Raman map (bottom panel) showing a CH4-rich inclusion in amphibole sampled from the close vicinity of the studied area.
