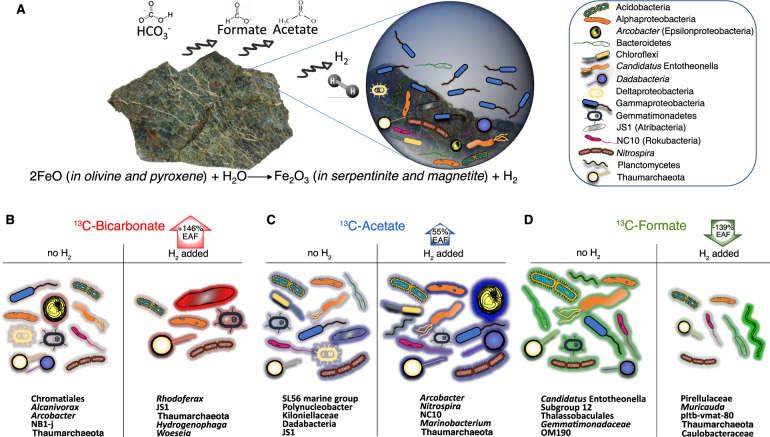
Fig. 8. Summary of group-specific qSIP-labeling patterns.
A The photograph is a piece of rock from partially serpentinized peridotite that was taken from SPSPA for the qSIP incubations. The cartoon diagram in the upper right shows the corresponding groups that assimilated carbon in the presence (or absence) of H2. B–D The plots below show the main groups that were responsible for carbon assimilation of different substrates with, and without H2. The extent of red/blue/green shading on the outside of the cells corresponds to 13C-labeling from CO2/acetate/formate. The percentage number (inside the arrows) indicates the average increase or decrease in 13C-assimilation (EAF) in the community with the addition of H2.

