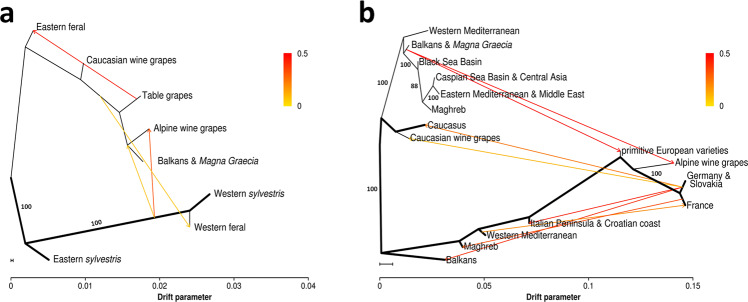
Fig. 1. Split and admixture events in groups defined by population structure in the WGS panel (a) and by geographic distribution in the diversity panel (b).
a Maximum likelihood (ML) tree with four groups of cultivated varieties (Supplementary Fig. 10) and four groups of wild accessions (Supplementary Fig. 7). Ancestry composition and group sizes are illustrated in Supplementary Fig. 10. b ML tree with nine groups of cultivated varieties and seven populations of sylvestris. Ancestry composition, group sizes, explained variance and the description of sylvestris–sylvestris admixture are given in Supplementary Fig. 22. a, b Migration events are indicated by colored arrows. The color scale shows the migration weight. The scale bar shows ten times the average standard error of the estimated entries in the sample covariance matrix. Bold lines indicate the sylvestris branches of the tree. Trees represent random trees and numbers represent bootstrap support values above 70% (100 iterations) before adding migrations. Support for the migration events and the resulting predictive model is given in Supplementary Figs. 20 and 22c, Supplementary Table 1, and Supplementary Data 2.

