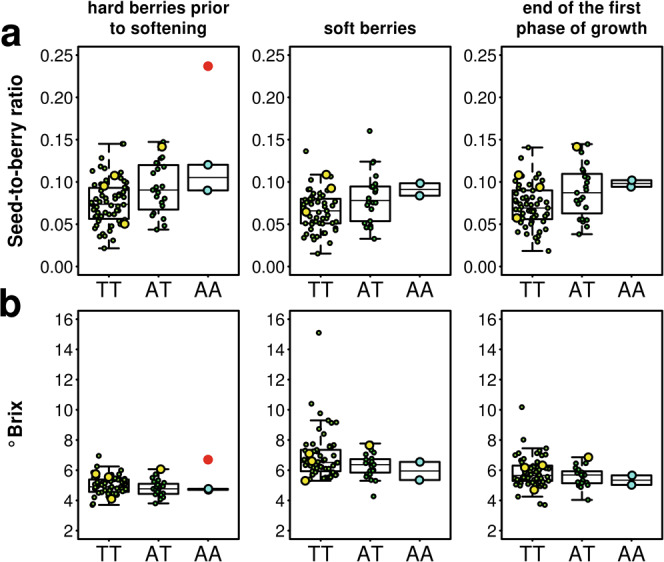
Fig. 6. Association analysis between SNPs and seed-to-berry ratio at the onset of berry ripening.

a Association between a A → T mutation in the VIT_217s0000g05570 gene, which recapitulate the increase in berry–specific expression of the kinase, and seed-to-berry ratio in hard berries prior to softening, soft berries collected over the same bunch and their average (as a proxy for the end of the first phase of berry growth). Box-plots show 88 accessions (green dots) sorted by their genotype at the SNP_chr17:6,079,793. Accessions with missing AA, AT, TT genotypes were classified based on their alternate/alternate, alternate/reference and reference/reference genotypes, respectively, at the variant sites chr17:6,080,166; 6,079,793; 6,080,193; 6,080,258; 6,080,447; 6,080,449, which are all in LD with chr17: 6,079,793 in the H1-A haplotype. b Variation in soluble solids concentration in the same berries and accessions as in a. Red dots indicate values in hard berries of sylvestris V395. Yellow dots indicate values in eastern feral grapes. Cyan dots indicate values in Berzamino and Gordin Verde. Boxes indicate the first and third quartiles, the horizontal line within the boxes indicates the median and the whiskers indicate ±1.5 × interquartile range. Source data are provided as a Source Data file.
