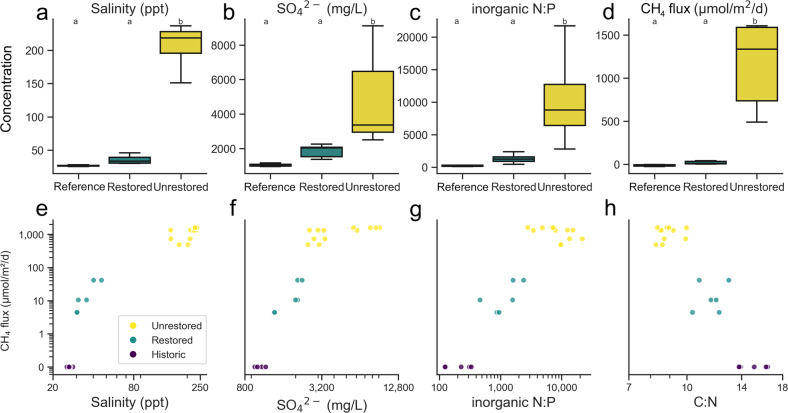
Fig. 1. Biogeochemistry of sampled sites.
Variation of salinity (Cl−) (a), sulfate (b), inorganic N:P ratio (c), and methane fluxes (d) in restored/unrestored salt ponds and reference wetland. Methane fluxes were positively correlated with salinity (e), sulfate (f), and inorganic N:P ratio (g) and negatively correlated with C:N ratios (h). Note the change in the y-axis scale in panels (a−d) and the logarithmic scale in panels (e−h). Different letters delineate significant pairwise comparisons (Nemenyi posthoc, P < 0.05).

