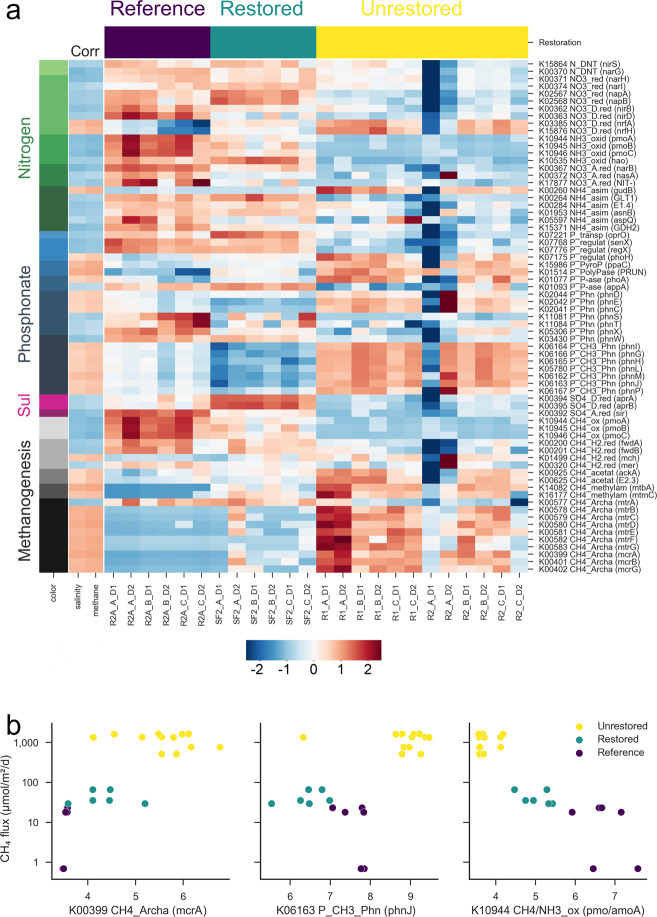
Fig. 3. Functional genes for element cycling correlated with methane.
(a) A heatmap of functional gene abundances in shotgun metagenome data; genes are color-coded by element cycle and pathway, and selected genes are shown, where correlations with methane had Spearman’s r > 0.5 from 149 unique CNPS genes. Correlations with CH4 fluxes and salinity across all sites are shown in the leftmost heatmap. The central heatmap shows the relative abundance of these genes across sites (values in the heatmap had a step of z-transformation for a better visualization by Seaborn Python package (https://seaborn.pydata.org/), with site type indicated by the bars at the top. The function names of genes were truncated to save space; full names are in Table S3. Scatterplots in (b) show relationships between CH4 flux and key genes for methanogenesis (mcrA), demethylation of phosphonate (phnJ) and ammonia/methane oxidation (amo/pmoA) (DESeq2 normalized and log2 transformed). Note the logarithmic y-axis scale in panel (b).

