
FIGURE 3.
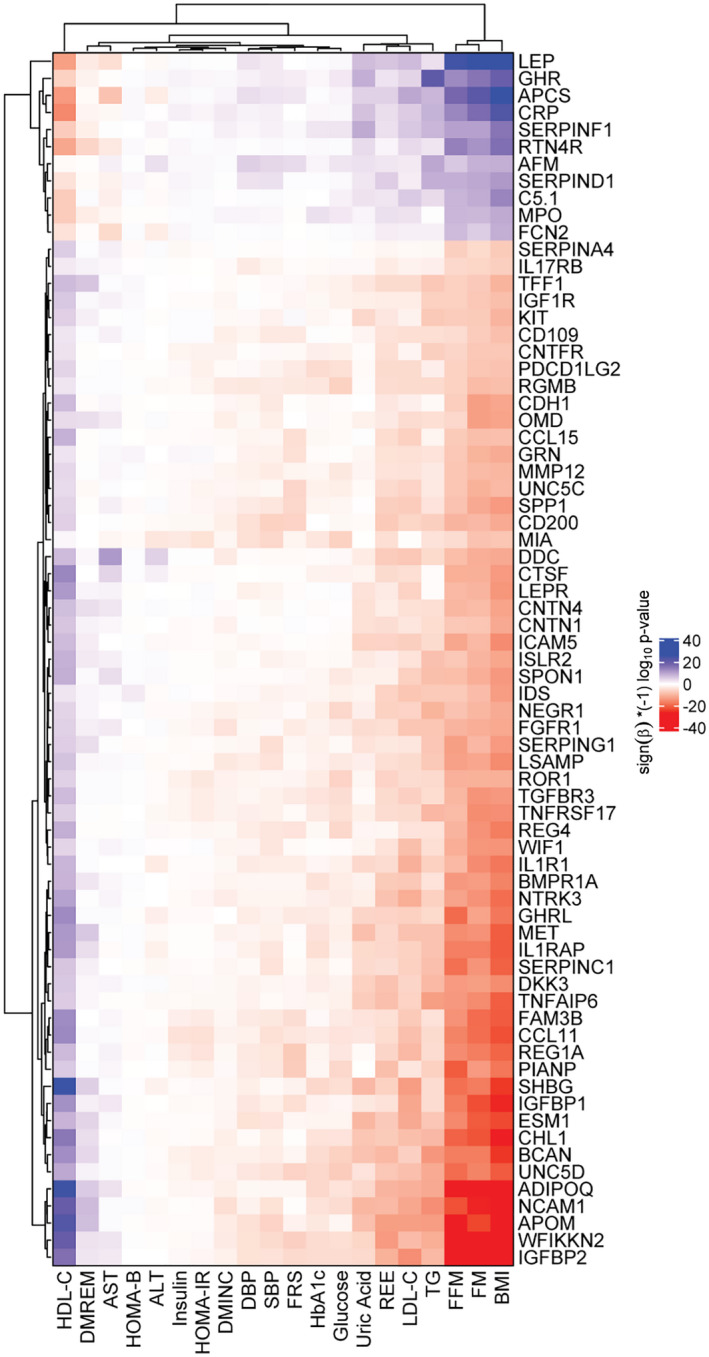
Heat map of clinical variable associations with the 71 protein changes that were associated with change in BMI from a regression model using combined surgery and nonsurgery groups. Colors represent (sign[β] × [−1]log10[p value]). Significance level is Bonferroni‐corrected p value (p ≤ 0.05/71/20 = 3.5 × 10⁻⁵) for 71 proteins and 20 clinical variables. Red indicates high significance with negative β (the protein increases with a decrease in the clinical variable), and blue indicates high significance with positive β