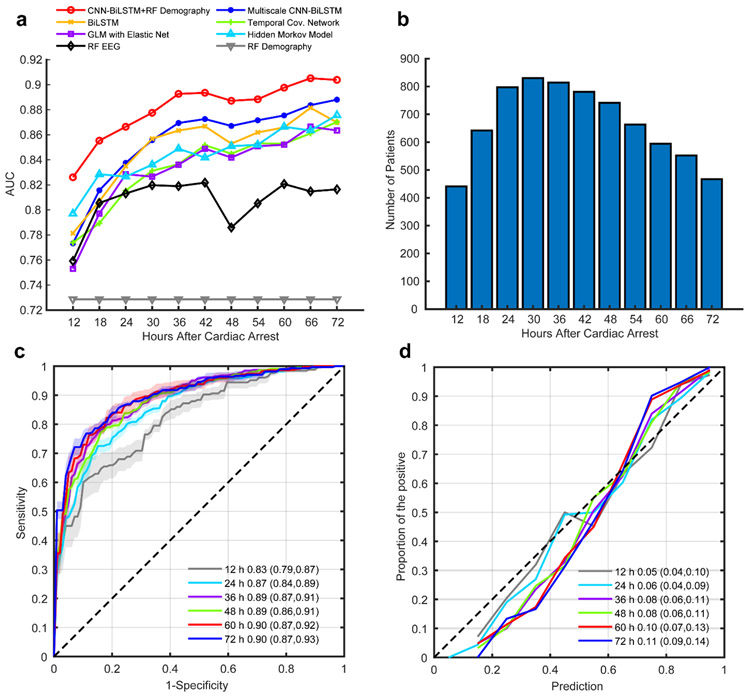
Fig. 2. Model performance of different models in outcome prediction.
a, Mean AUC values of different models within each 6-hour time interval. The proposed method (red line) performed best, exhibiting consistent improvement in performance with more observations (from mean AUC of 0.83 at 12 h to mean AUC of 0.90 at 72 h). b, Numbers of patients with EEG available with respect to time after cardiac arrest. c, Mean ROC curves at different time intervals. Shaded areas indicate the standard errors in 5-fold cross validation. d, Calibration curves at different time intervals. The numbers are calibration errors (deviations from the diagonals).

