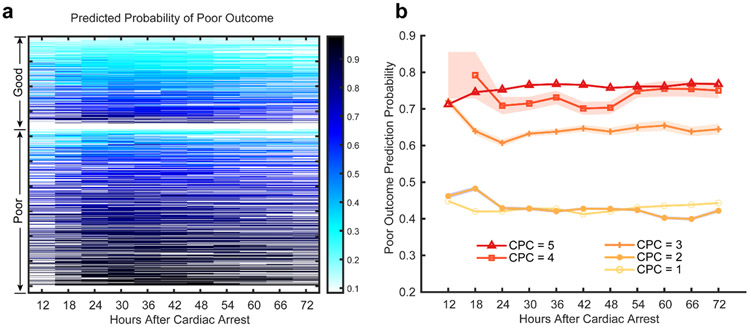
Fig. 3. Model performance of individual patients and CPC scores.
a, Individual prediction probabilities. Each row shows the output probabilities for one patient over consecutive 6h blocks, the darker the color, the higher the predicted probability of poor outcome. b, Predicted probabilities over time, grouped by final CPC scores. The overall mean predicted probabilities were consistent with the expected order of CPC scores.

