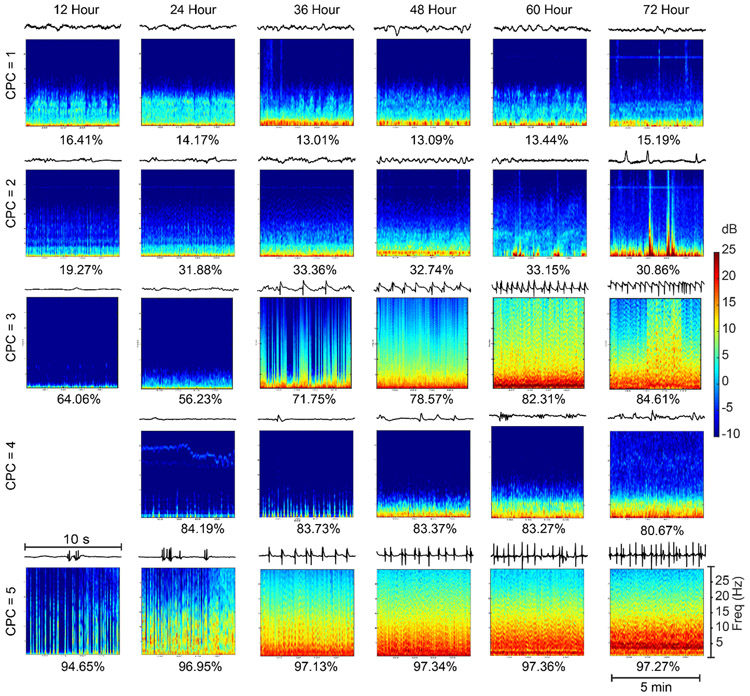
Fig. 4. Illustration of prediction results on sample patients.
Each row illustrates the mean multi-taper spectrogram and EEG waveforms in multiple time blocks. At the bottom of each spectrogram, prediction probabilities of the model for the corresponding EEG segments are shown. The time length of EEG snapshots was 10 s while the spectrograms spanning a 5-min time window are shown. The proposed model made good predictions based on the EEG patterns. Continuous EEG contributes to lower prediction probabilities of poor outcomes while epileptiform discharges with flat background contribute to high prediction probabilities of poor outcomes.

