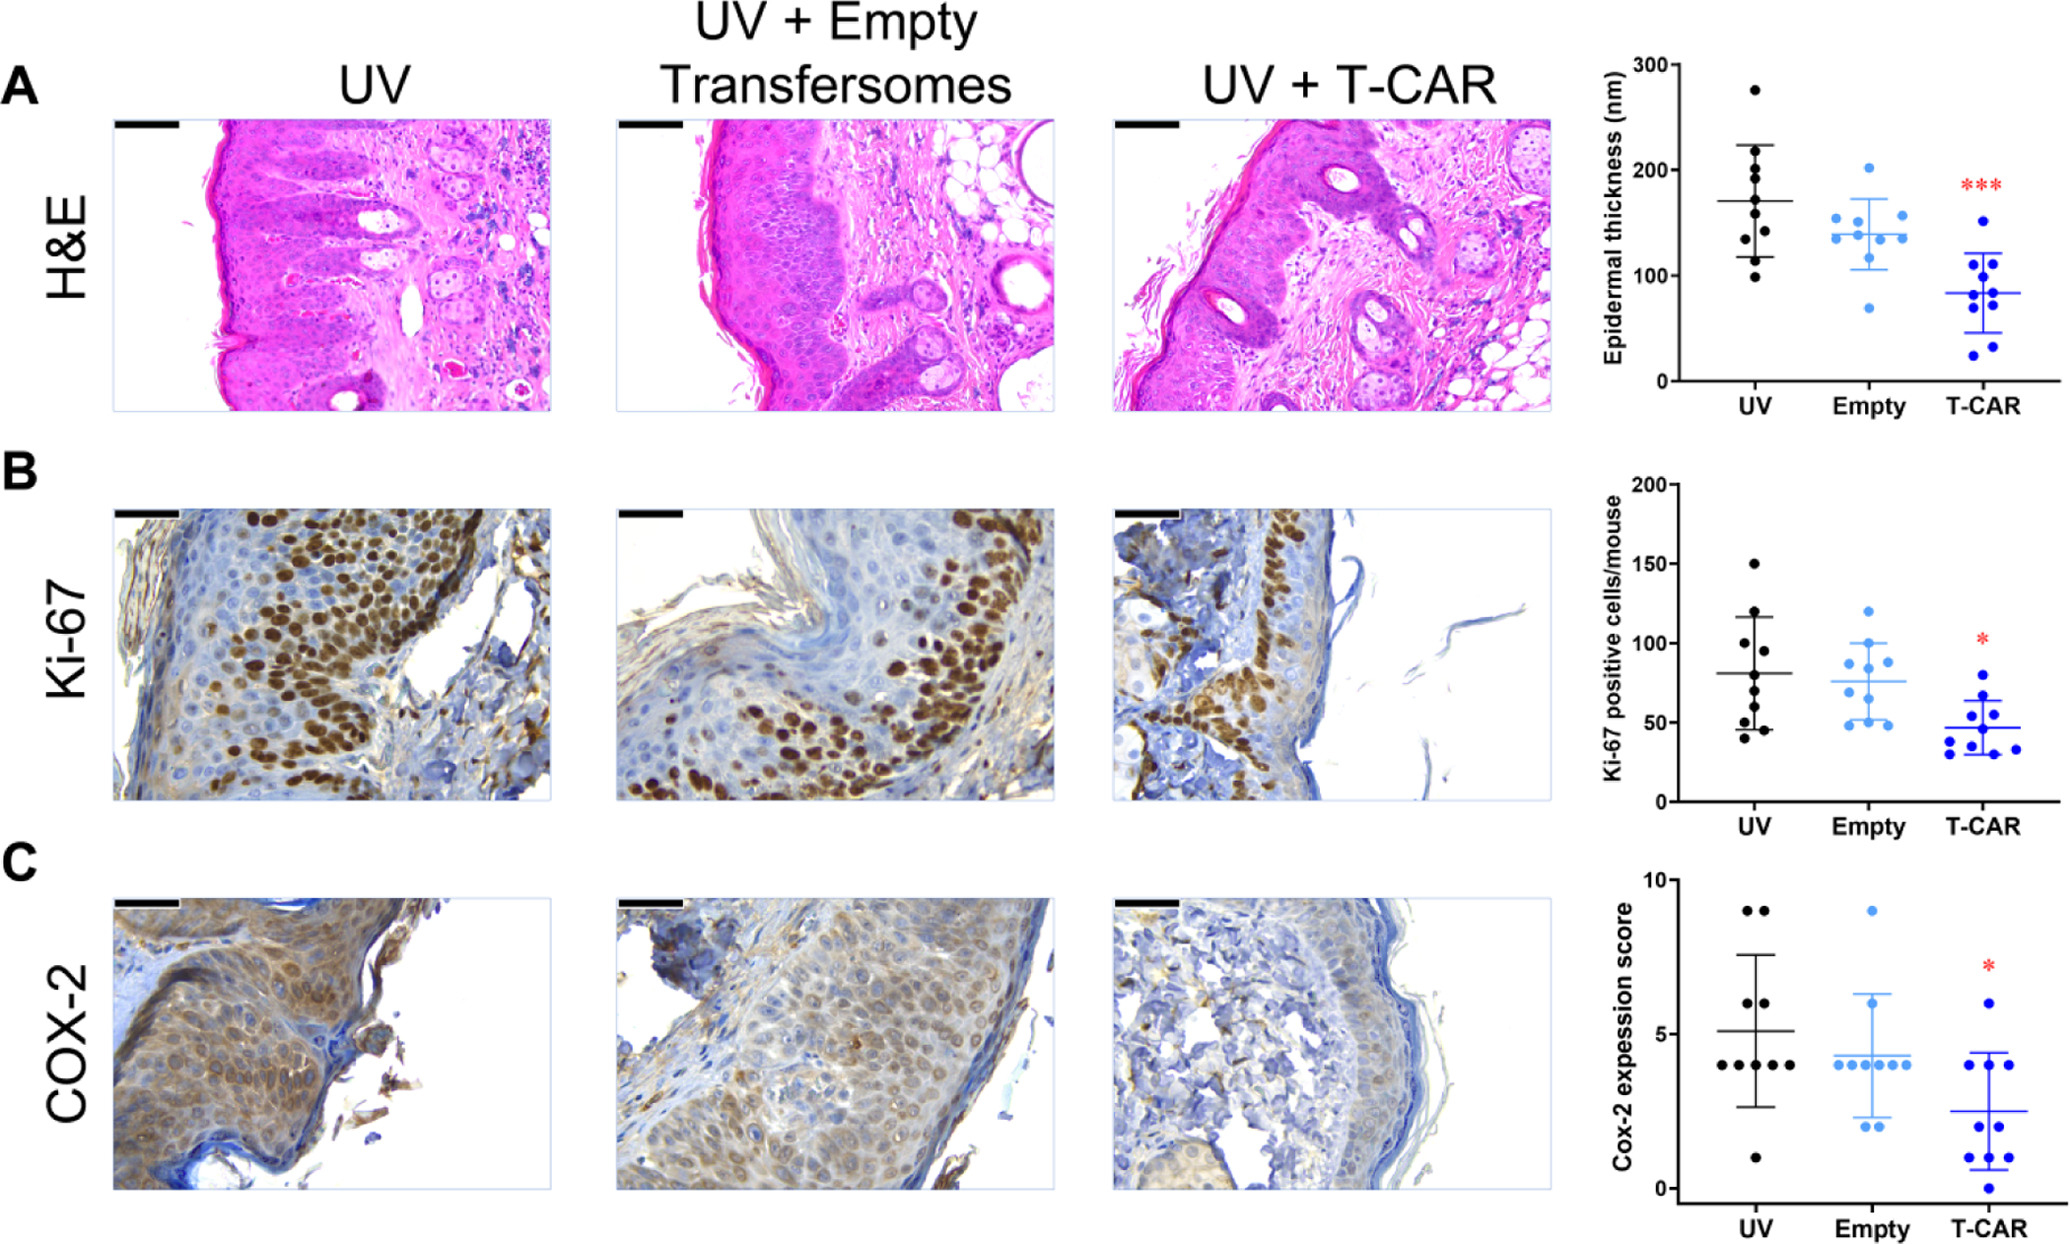
Figure 5. Effects of T-CAR gel on UV-induced skin tumors and inflammation in the skin surrounding the tumors in SKH-1 mice.

(A) Representative microphotographs of mouse skin stained with H&E. The thickness was measured five times at various locations along the epidermis and averaged to obtain a single skin samples data (n = 8). (B) Immunohistochemistry of Ki-67. Quantification of the number of Ki-67 positive cells (n = 8). (C) Immunohistochemistry of COX-2. The expression index was used to quantify the extent and intensity of COX-2 expression in each sample (n=8). An ANOVA followed by a Tukey-Kramer multiple-comparison post hoc test was used to assess statistical differences at p < 0.05. All data are shown with the mean ± SD.
