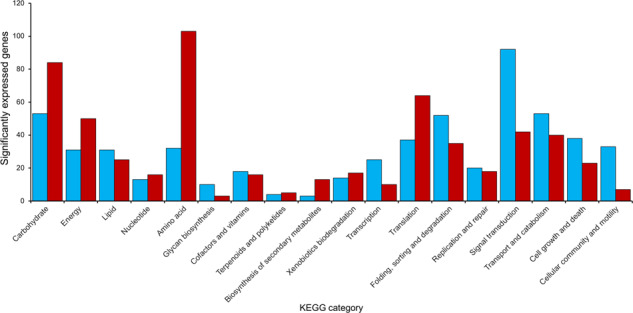
Fig. 2. Number of gene significantly differentially expressed for each KEGG metabolic pathways and cellular processes in Rhodotorula frigidialcoholis at 0 °C compared to 23 °C.

The total number of genes in each KEGG category that showed significant (p < 0.05) upregulation (≥1.5 log2FC) at 0 °C are indicated in blue. The total number of genes in each KEGG category that showed significant (p < 0.05) upregulation (≥1.5 log2FC) at 23 °C are indicated in red. Blue and red are equivalent to light gray and dark gray in the printed version.
