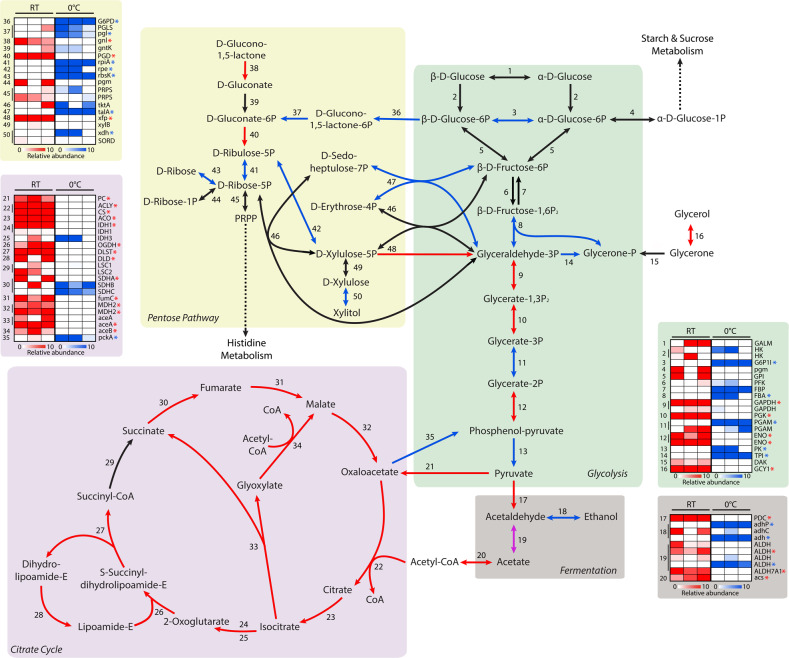
Fig. 4. Reconstruction of the Rhodotorula frigidialcoholis major carbohydrate metabolic pathways mapped with transcriptomic data.
Reconstructed carbohydrate metabolic pathways of R. frigidialcoholis based on the KEGG gene annotations and their relative differential gene expression profiles of each triplicate culture. The genes with a significant (p < 0.05) differential expression of ≥ 1.5 log2FC are indicated with an arrow (pathway) and a star (heatmap) in blue (overexpressed at 0 °C), red (overexpression at 23 °C), or purple (different homolog overexpressed at both 0 and 23 °C). The numbers in the pathways correspond to the numbers in the heatmaps. For the heatmaps, blue indicates an overexpression of the gene at 0 °C, red indicates and overexpression of the gene at 23 °C, and white indicates genes that are not differentially expressed between the two temperatures. A list of the abbreviations is included in the Supplementary material (Supplementary Table S5). .

