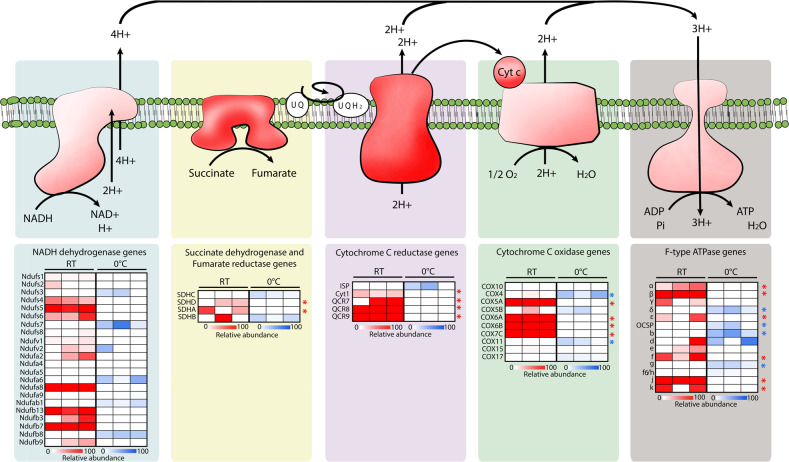
Fig. 5. Reconstruction of the Rhodotorula frigidialcoholis electron transport chain.
Reconstructed electron transport chain (ETC) complexes of R. frigidialcoholis based on the KEGG genes annotation (top) and their relative differential gene expression profiles of the ETC subunits (bottom) of each triplicate culture. The genes with a significant (p < 0.05) differential expression of ≥1.5 log2FC are indicated with a star in blue (overexpressed at 0 °C), or red (overexpression at 23 °C). For the heatmaps, blue indicates an overexpression of the gene at 0 °C, red indicates and overexpression of the gene at 23 °C, and white indicates genes that are not differentially expressed between the two temperatures.

