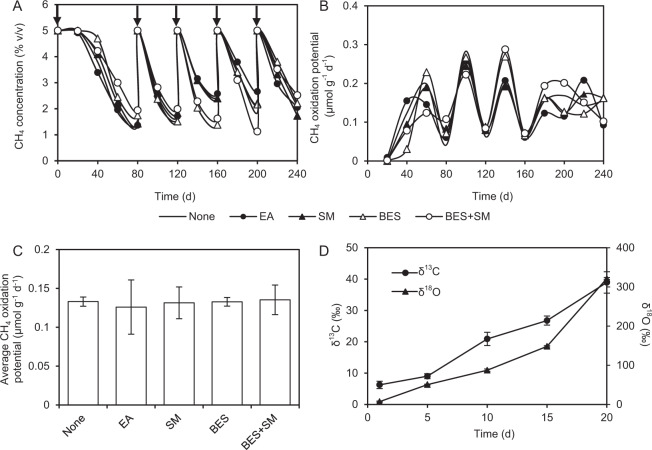
Fig. 3. CH4 oxidation activities of sediments in the stable-isotope-probing (SIP) microcosm.
The average CH4 concentration in the headspace (A), average CH4 oxidation potential at each time point (B) and average CH4 oxidation potential of each treatment during the whole SIP microcosm incubation (240 d) (C), and the δ13C and δ18O of CO2 in the headspace of the serum vials without the addition of inhibitors or electron acceptors (D) (n = 3). Five treatments were constructed by adding 2-bromoethanesulfonic acid (BES, a methanogen-specific inhibitor) and/or sodium molybadate (SM, a specific inhibitor for sulfate reduction), or Na2SO4 (EA, as a supplementary electron acceptor) into the vials to adjust the final concentrations of BES, SM and Na2SO4 to 10, 5,and 3 mM, respectively. The five treatments were as follows: (1) the addition of BES and SM (BES+SM); (2) the addition of BES (BES); (3) the addition of SM (SM); (4) the addition of EA (EA); (5) unamended (none). The gas composition was 1–2% of H2, 5% of CH4 and 93–94% of N2 in the headspace of the serum vials. The arrows indicate timepoints when 12CH4/13CH4 was injected to reinstate the initial headspace CH4 concentration. Error bars indicate standard deviation. Error bars are not shown in A and B for visual clarity.

