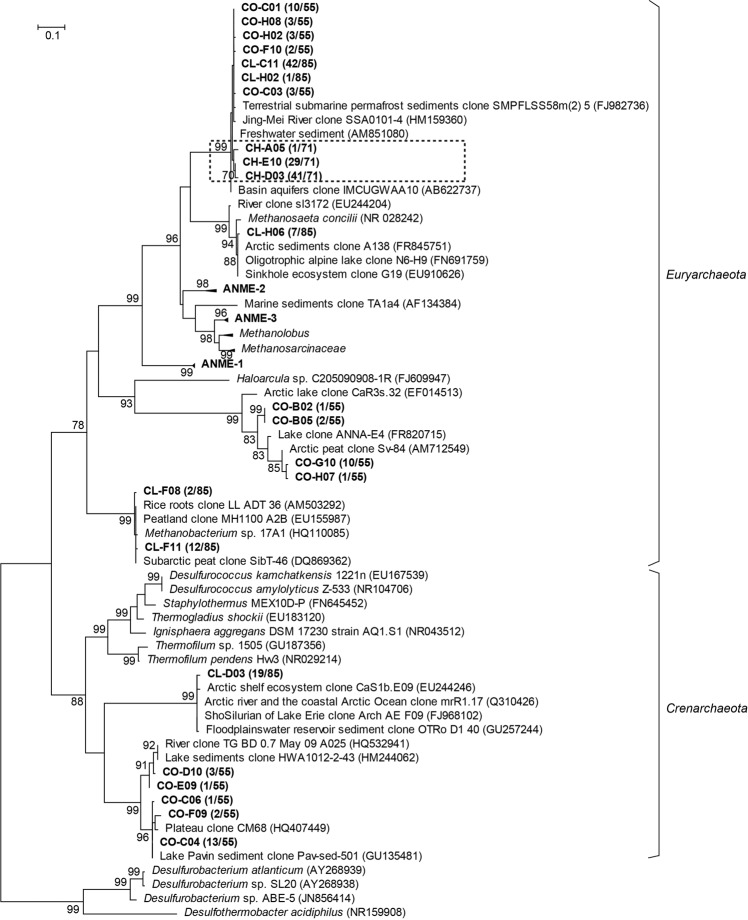
Fig. 5. Maximum-likelihood tree of representative archaeal 16S rRNA gene sequences directly amplified from the heavy (CH) and light (CL) fractions from 13CH4 incubations and original sediment DNA (CO).
The scale bar represents 0.1 substitutions per nucleotide position. Bootstrap values >70 are shown. The first number (before the “/”) in parentheses is the number of clones in the same operational taxonomic unit (OTU) assigned by CAP3 sequence assembly program with 97% similarity; the number after the “/” in parentheses is the total clones in CH, CL, and CO libraries, respectively.

