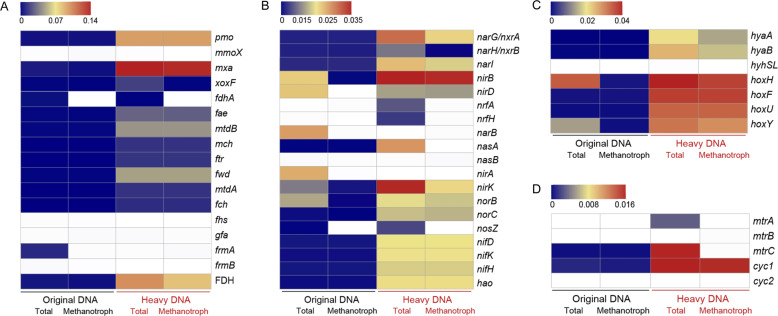
Fig. 7. A heatmap of the relative abundance of the main genes involved in CH4 oxidation, nitrogen, hydrogen and iron metabolism in the heavy DNA and the original sediment.
CH4 oxidation (A), nitrogen metabolism (B), hydrogenase (including uptake hydrogenase and bidirectional hydrogenase) (C), and genes possibly involved in iron oxidation and reduction (D). The numbers in the scales show the relative abundance of assembled genes based on read mapping. White denotes that the gene was not detected. “Total” refers to the total relative abundance of the genes; “methanotroph” refers to the genes assigned as the known aerobic methanotrophs using MEGAN (version 5.3) and BLASTX analysis using the NCBI-nr database (2016–09).

