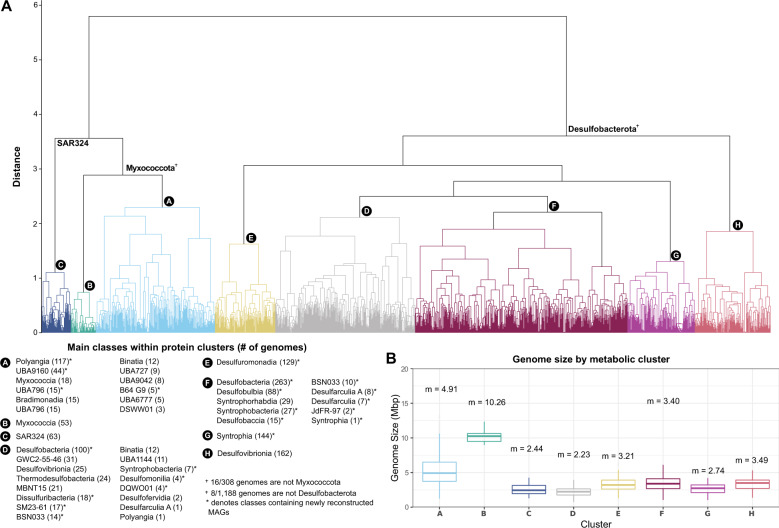
Fig. 2. Overview of eight genomic clusters identified through protein clustering.
(A) Dendrogram of genomic groups (labeled A–H) based on their protein content similarity (determined using Jaccard distance and Ward variance minimization, see methods). Genomic groups include 1559 Desulfobacterota, Myxococcota, and SAR324 genomes that were clustered based on their protein family content using a set of 17 395 pfam domains (see methods). General taxonomic representatives are provided in the dendrogram and more detailed information about the classes present within clusters is provided in the lower-left box labeled “Classes within protein clusters”. Numbers in parentheses in the lower-left box show the number of genomes within that class. Classes that contain MAGs reconstructed in this study are shown with an asterisk. (B) Box plot distribution of genome size in Mbp of all genomes included in the eight metabolic clusters shown in panel (A). Each box plot shows the mean genome size of that cluster. The upper boundary of a box plot represents the 75% quantile, and the lower boundary is the 25% quantile. The middle line in each box plot represents the median. Upper whiskers are the largest observation less than or equal to the upper hinge +1.5 * the interquartile range (IQR), while lower whiskers are the smallest observation greater than or equal to the lower hinge −1.5 * IQR.

