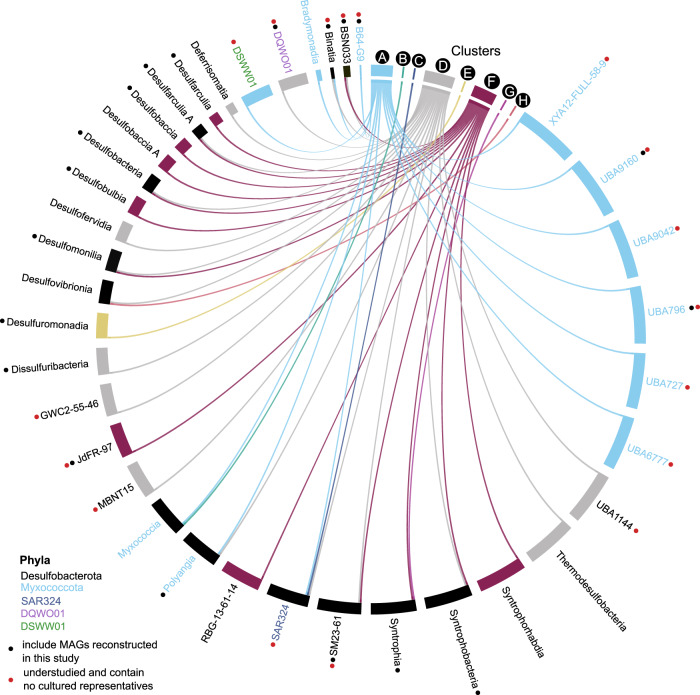
Fig. 3. Distribution of taxonomic lineages within eight genomic clusters.
Circos visualization map showing the relationship between metabolically related groups (genomic clusters based on their protein content similarity: A–H) and their corresponding taxonomy. The connections are drawn from clusters A-H to classes of Desulfobacterota, Myxococcota, or SAR324. Those with red dots are groups that contain MAGs reconstructed in this study and have no cultivated members (See U groups in Fig. 1). Black dots signify classes with newly reconstructed MAGs from cultured groups. Classes are colored according to their corresponding phylum.

