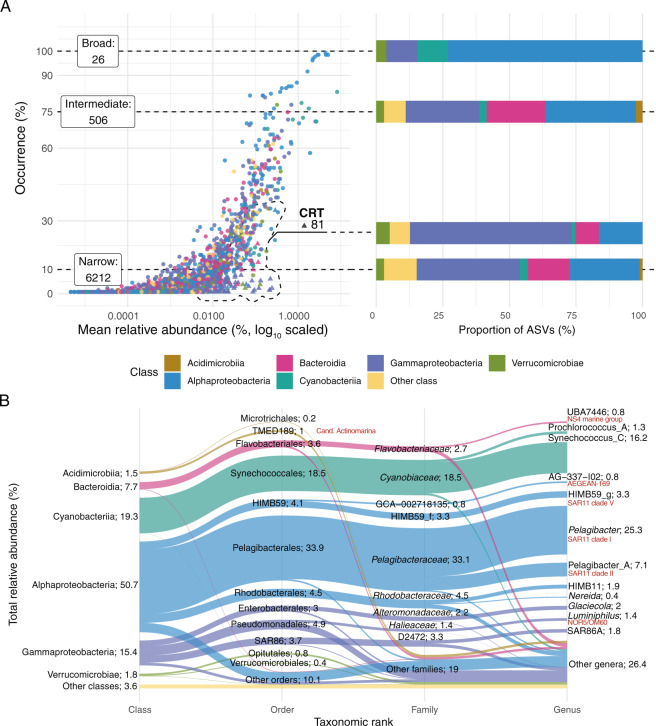
Fig. 1. Community structure in the Blanes Bay Microbial Observatory.
A Distribution of the different ASV types (broad, narrow or intermediate, and conditionally rare taxa, CRT). The X axis indicates the occurrence (% of samples) and the Y axis corresponds to the mean relative abundance (%) over the time series. Dotted lines delimitate the distributions (the numbers of ASVs of each type are displayed in the label) and connect to a box indicating the number of ASVs for each distribution and a bar plot colored by taxonomy at the class rank. CRT taxa are following a bimodal distribution and present ≥1% relative abundance in at least one sample. B Alluvial plot showing the total relative abundance distribution of Blanes Bay taxa across different taxonomic ranks (class, order, family, and genus). The height of the sections displays the relative abundance (indicated in the text; the total is 100%). The SILVA nomenclature is displayed in red next to the corresponding GTDB database nomenclature.

