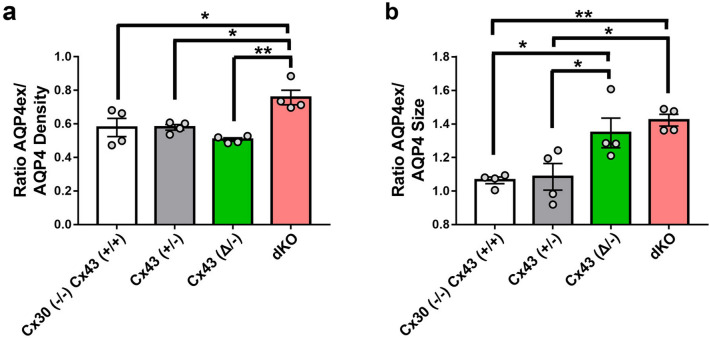
Figure 7.
Ratio of AQP4ex/AQP4 density and size in perivascular brain regions of the Cx43 genotypes. (a) Ratios of particle densities of AQP4ex to AQP4 shows that dKO has higher ratio than the other genotypes. (b) Ratios of particle sizes shows that Cx43(+/+) and Cx43(+/−) are similar but the size of AQP4 is smaller than AQP4ex for the other groups. Data are presented as mean ± SEM (ANOVA followed by Tukey’s post hoc test: *p < 0.05 and **p < 0.01).

