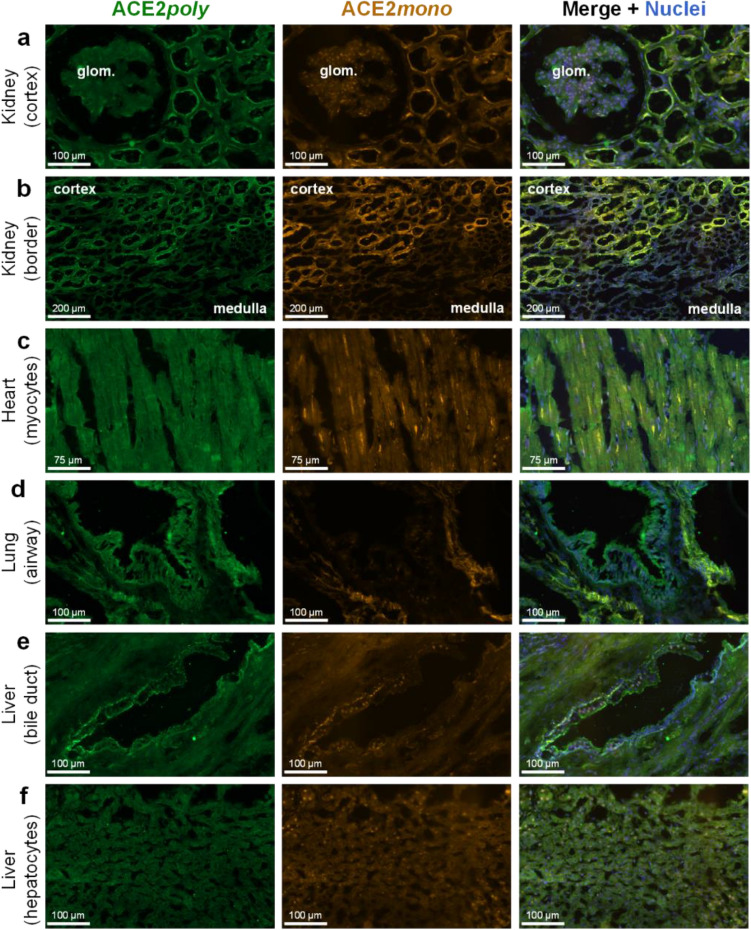
Figure 3.
Differential expression of full-length ACE2 and the short dACE2 isoform in a panel of human tissues. Representative fluorescent images (n = 3 independent donors, stained in duplicate) of human tissue fixed in 4% formaldehyde and treated with ACE2poly (left column, visualised in green) and ACE2mono (centre column, visualised in orange). Merged images (right column, overlay) also include Hoechst 33342 nuclear marker (visualised in blue). Scale bars are as indicated in figure. Tissues shown include: (a) Kidney cortex, with a glomerulus (glom.) indicated; (b) Kidney border, showing a region where tubules of the cortex meet tubules of the medulla; (c) Heart tissue, showing cardiomyocytes; (d) Lung tissue, showing an airway structure; (e) Liver bile duct; (f) Liver hepatocytes.

