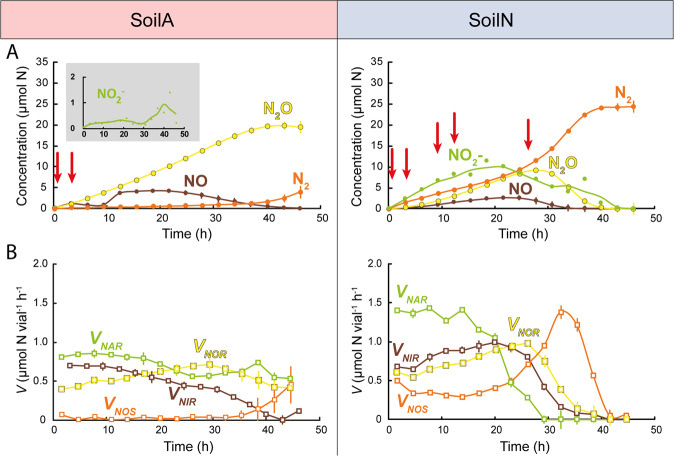
Fig. 1. Kinetics of NO2−, N-gases and denitrification enzyme rates.
Results for anoxic incubation of two soils with pHCaCl2 = 3.8 (SoilA) and 6.8 (SoilN), amended with NO3−. A Measured amounts of NO2−, NO, N2O and N2. Sampling for metatranscriptome analyses are indicated by red arrows (0.5 and 3 h for SoilA; 0.5, 3, 9, 12 and 27 h for SoilN). B Reduction rates for the different denitrification steps VNAR (NO3− → NO2−), VNIR (NO2− → NO), VNOR (NO → N2O) and VNOS (N2O → N2), all given as µmol N vial−1 h−1. The values were based on the measured kinetics of NO2−, NO, N2O and N2 and corrected for abiotic decomposition of NO2− as published previously by Lim et al. [28]. Abiotic NO2− decomposition was significant only in SoilA. The figure is adapted from graphs shown in [28] and based on the same dataset.

