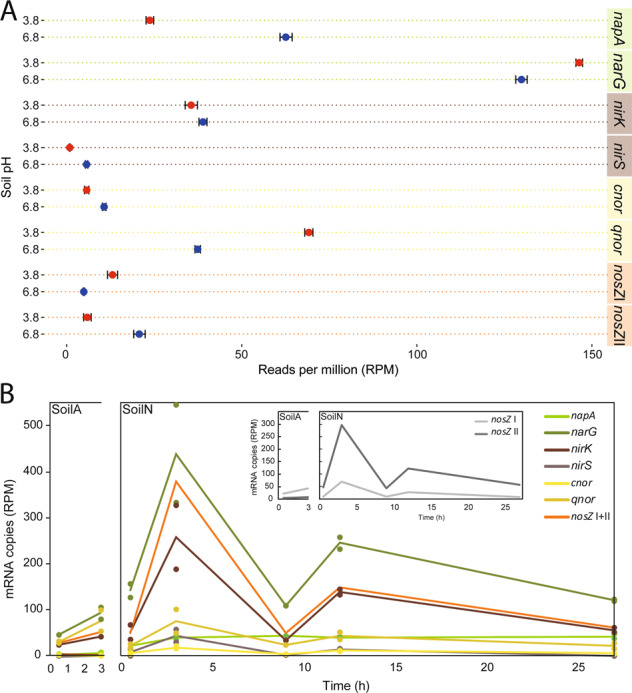
Fig. 3. Genetic potential and transcription of selected denitrification genes.

A Metagenome analysis showing a comparison of the abundance of denitrification genes in SoilA and SoilN based on number of reads annotated to the gene in question per total number of reads in the sample. Averages of triplicate soil samples taken at the start of the incubation for metagenomics analysis. Bars indicate standard deviation. B Metatranscriptome analysis showing changes in the abundance of denitrification gene transcripts during the first 3 h of incubation for SoilA and 27 h for SoilN. Averages (lines) and individual data points are shown for duplicate soil samples taken after 0.5, 3, 9, 12 and 27 h of anaerobic incubation. Reads of nirS transcripts were not detected in SoilA. The insert shows the transcriptional dynamics of the two nosZ clades only, for clarity.
