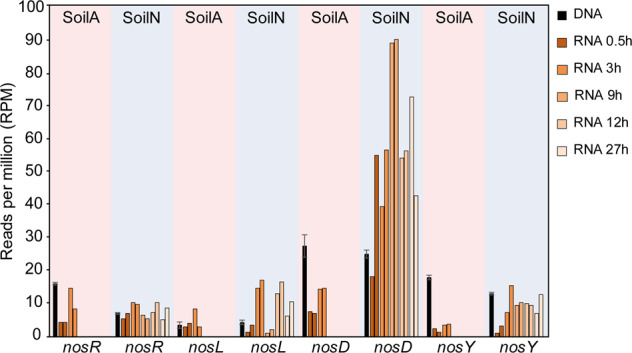
Fig. 4. Abundance of selected genes in the nos operon and their transcription over time.

Metagenome and metatranscriptome analyses of two soils (SoilA, pH = 3.8 and SoilN, pH = 6.8). Black bars show average gene read abundances in the metagenome (n = 3; bars show sd). Colored bars show transcript read abundances after 0.5 and 3 h of incubation (SoilA) and after 0.5, 3, 9, 12 and 27 h of incubation (SoilN). Duplicate samples were analysed for each sampling point, shown as individual bars with the same color.
