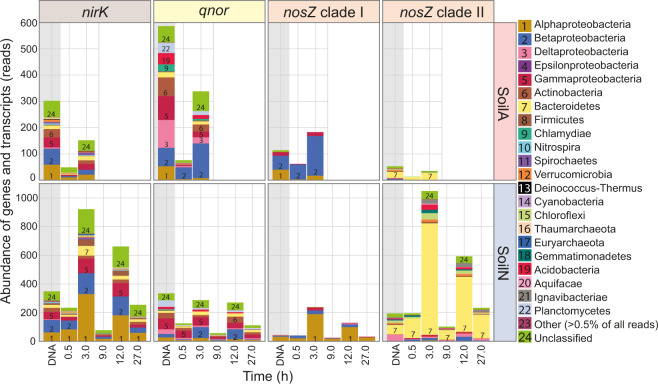
Fig. 6. Taxonomic distribution of selected denitrification genes and transcripts.
Abundance of annotated reads obtained from the metagenome (DNA), sampled at the start of incubation and from the metatranscriptome, sampled after 0.5 and 3 h anoxic incubation (SoilA) and 0.5–27 h anoxic incubation (SoilN) (for sampling points also see Fig. 1A). Averages of summed reads across replicate samples (n = 3 for metagenomes; n = 2 for metatranscriptomes). A detailed list of all read abundancies is found in Supplementary materials Table S2, which also includes read abundancies for the other denitrification genes.

