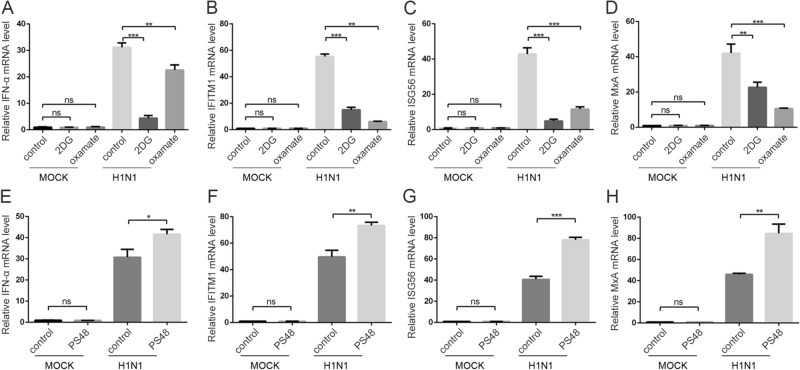
Fig. 5.
The effect of glycolysis inhibitors or enhancer on interferon induction. A–D A549 cells were mock infected or infected with H1N1 at an MOI of 1, with or without 50 mmol/L 2DG or 100 mmol/L oxamate treatment at the same time. Cells were harvested at 24 h p.i., and IFN-α (A), IFITM1 (B), ISG56 (C), and MxA (D) mRNA levels were measured by qRT-PCR. β-actin expression was used as an internal control. E–H A549 cells were mock infected or infected with H1N1 at an MOI of 1, with or without 10 mmol/L PS48 treatment at the same time. Cells were harvested at 24 h p.i., and IFN-α (E), IFITM1 (F), ISG56 (G), and MxA (H) mRNA levels were measured by qRT-PCR. β-actin expression was used as an internal control. **P < 0.01, ***P < 0.001.

