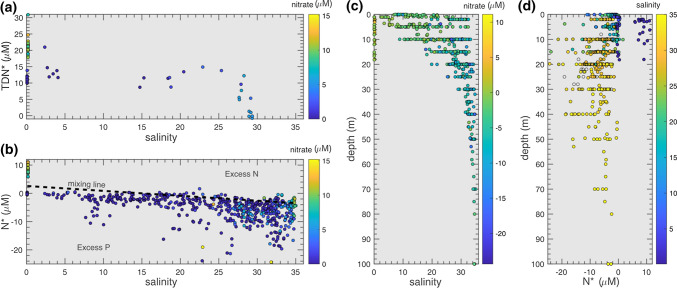
Fig. 5.
Variability in a TDN* and b N* with changing salinity through the Lena Delta and into the Laptev Sea with nitrate plotted in colour. Variability in c salinity and d N* in the upper 100 m of the Lena Delta and Laptev Sea with salinity plotted in colour. Data from the Lena Delta are from Sanders et al. (2022). A mixing line is added to b between the marine (N* = -3.3 μM, salinity = 34.8) and riverine endmembers (N* = 2.2 μM, salinity = 0)

