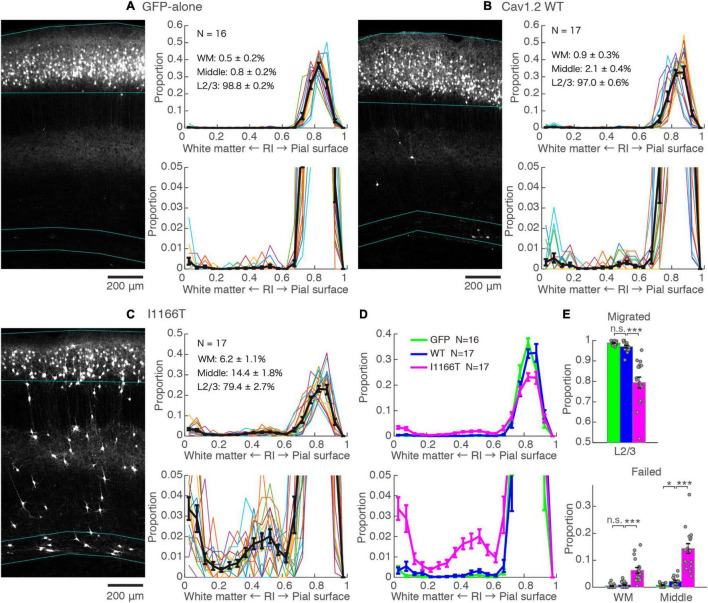
FIGURE 2.
Expression of the Cav1.2 I1166T mutant caused neuronal migration deficit. (A) Left, GFP images of electroporated cortex in the GFP-alone group. Cyan lines represent the top; pial surface, the bottom edge of the GFP-positive neuron cluster, and the top and bottom edge of white matter (see section “Materials and Methods”). Right, histogram of radial index (RI) of the GFP-positive neurons. Colors, each sample. Black, mean ± SEM. Y-axis is enlarged and shown at the bottom. (B,C) Images and histograms of the Cav1.2WT group (B) and Cav1.2I1166T group (C), as shown in (A). (D) Histogram of the mean ± SEM are merged for GFP-alone, Cav1.2WT, and Cav1.2I1166T groups. (E) Proportion of correctly migrated neurons (top) and migration-failed neurons in WM and Middle (bottom). Independent values and mean ± SEM are shown. ***P < 0.001; *P < 0.05; n.s., P ≥ 0.05.

