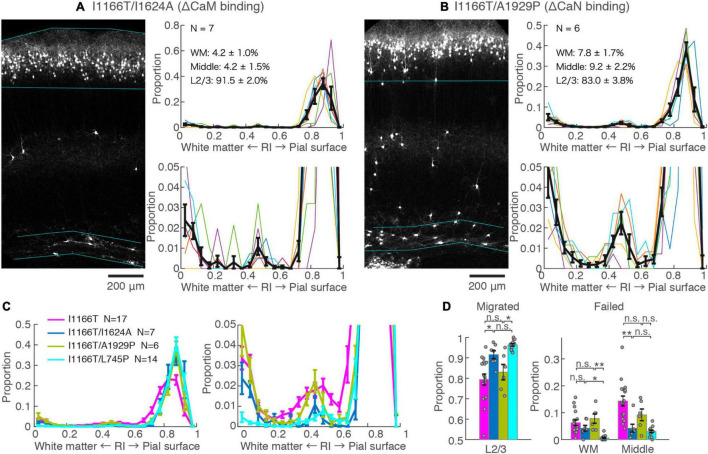
FIGURE 4.
Blockade of CaM-binding but not CaN-binding rescues the migration deficit. (A,B) GFP images and histograms of the Cav1.2I1166T/I1624A (A) and Cav1.2I1166T/A1929P group (B), as shown in Figure 2A. (C) Histogram of the mean ± SEM are merged for Cav1.2WT, Cav1.2I1166T/I1624A, Cav1.2I1166T/A1929P, and Cav1.2I1166T/L745P groups. (D) Proportion of correctly migrated neurons (left) and that of migration-failed neurons located in WM and Middle (right). Independent values and mean ± SEM are shown. **P < 0.01; *P < 0.05; n.s., P ≥ 0.05.

