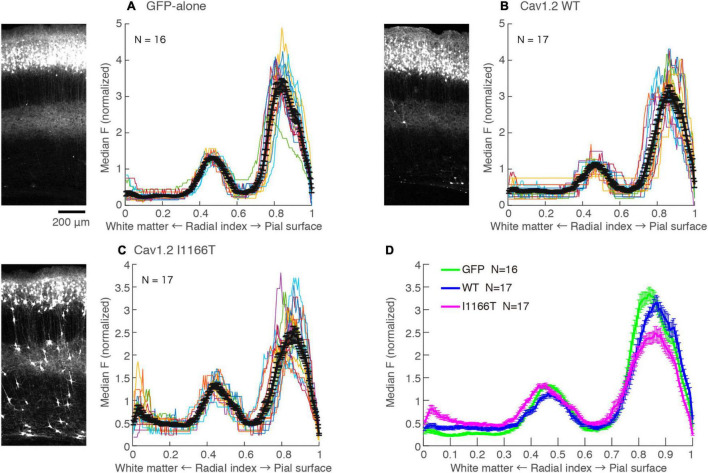
FIGURE 6.
Local axonal arborization in the ipsilateral cortex is not affected by the expression of Cav1.2 mutants. (A) Left, An example GFP image in the electroporated hemisphere of GFP-alone group. A strong GFP signal was seen in the upper layer, representing cell bodies, dendrites, and axons of GFP-expressing neurons. A strong signal was also seen in the middle of the cortex, representing axons of neurons migrated to the L2/3. Right, the medians of GFP intensities are calculated along the tangential axis of the images. Colors, each sample. Black, the mean ± SEM. (B,C) GFP images and median intensities of Cav1.2WT group (B) and Cav1.2I1166T group (C), as shown in (A). Because migration-failed neurons were sparse in the middle of the cortex, their strong signals could be excluded and axonal signals could be obtained by calculating the medians. (D) The values of mean ± SEM of three groups are merged.

