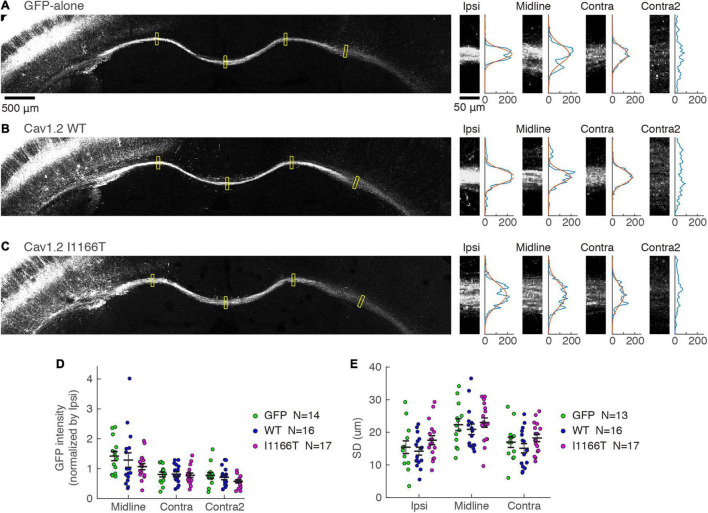
FIGURE 7.
Axonal projection in the white matter is not affected by the Cav1.2 I1166T mutation. (A) Left, GFP images of white matter in the GFP-alone group. Yellow squares represent the four areas shown on the right. Right, GFP images of Ipsi, Midline, Contra, and Contra2 areas. Intensities of each area were averaged in the horizontal axis and shown on the right. Gaussian fit to the intensity distribution is shown in red. (B,C) Axonal projections of the Cav1.2WT (B) and Cav1.2I1166T (C) groups are shown as in (A). (D) GFP intensities normalized by that of Ipsi are shown for each sample and the mean ± SEM for the GFP-alone, Cav1.2WT, and Cav1.2I1166T groups. All the combination of groups had insignificant differences (P > 0.09). (E) Broadness of axon bundles in white matter, represented by the standard deviation of Gaussian curves, are shown for each sample and the mean ± SEM for the GFP-alone, Cav1.2WT, and Cav1.2I1166T groups. All the combination of groups had insignificant differences (P > 0.1).

