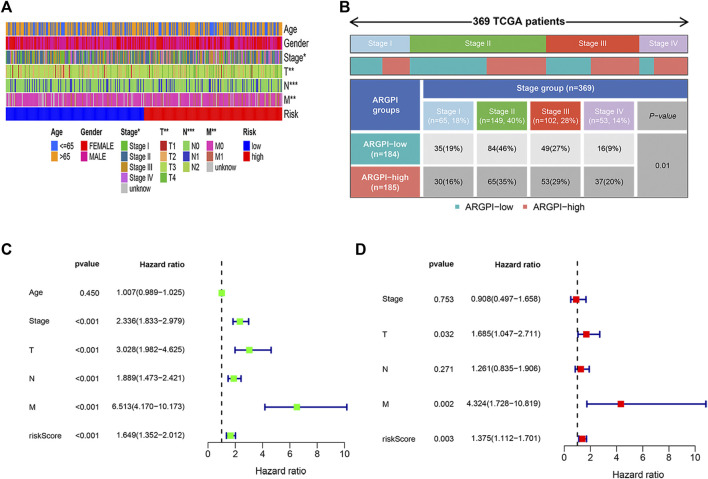
FIGURE 4.
Clinical characteristics and independent prognosis of different ARGPI subgroups. (A) Distribution of clinical characteristics of ARGPI subgroup in TCGA cohort. (B) Differential distribution of tumor stage in ARGPI subgroup in TCGA cohort (p = 0.01). (C) Univariate Cox analysis of clinicopathological factors and the ARGPI score. (D) Independent prognostic analysis included clinicopathological factors and ARGPI score.

