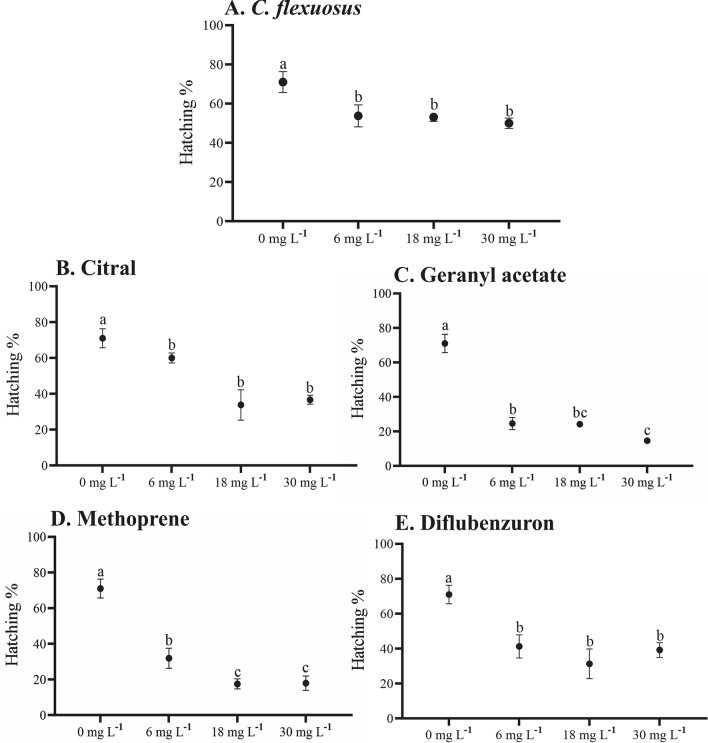
Figure 2.
Hatching percentages of Aedes aegypti eggs subjected to different concentrations (6, 18, and 30 mg L−1) of (A) Cymbopogon flexuosus essential oil (analysis of variance [ANOVA]: F = 7.41776, df = 3, p = 0.019205); (B) citral (ANOVA: F = 17.5349, df = 3, p = 0.001232); (C) geranyl acetate (ANOVA: F = 77.8167, df = 3, p = 0.000034); (D) methoprene (ANOVA F = 50.9635, df = 3, p = 0.000040); (E) diflubenzuron (ANOVA: F = 15.3481, df = 3, p = 0.003203). Different letters (a, b, and c) indicate statistically significant differences between the concentrations of substances and the control group (Tukey’s test, p ≤ 0.05).

