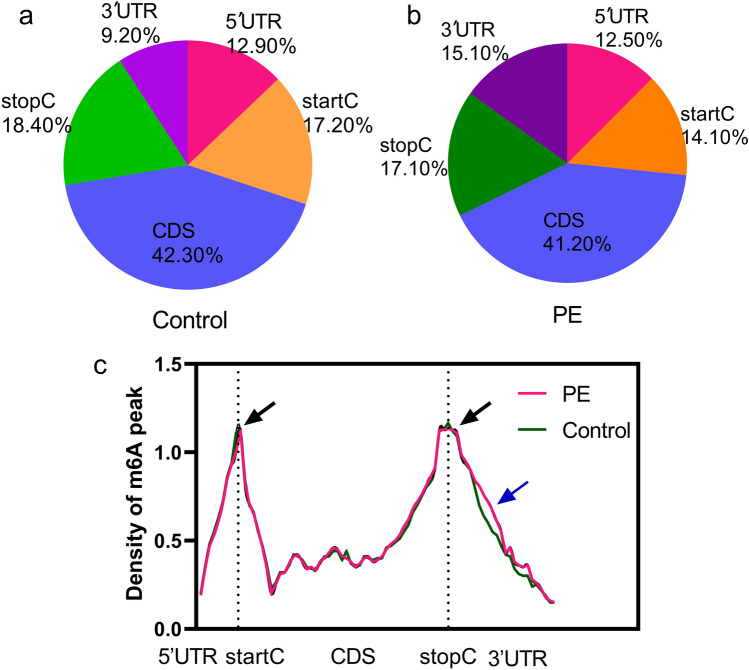
Figure 2.
Results of m6A RNA sequencing data analysis with the HOMER or Python annotation tool. Proportions of m6A peaks distributed in the 5′-untranslated region (5′UTR), start codon (startC), coding DNA sequence (CDS), stop codon (stopC) and 3′-untranslated region (3′UTR) across the entire set of circRNA-corresponding transcripts in PE and control samples (a, b). Density distribution of m6A peaks across mRNA transcripts (c). m6A peaks were abundant near the startC or stop codon (stopC) (black arrow). We found that the density of m6A at the 3′UTR in PE placentas was higher than that in control placentas (blue arrow).

