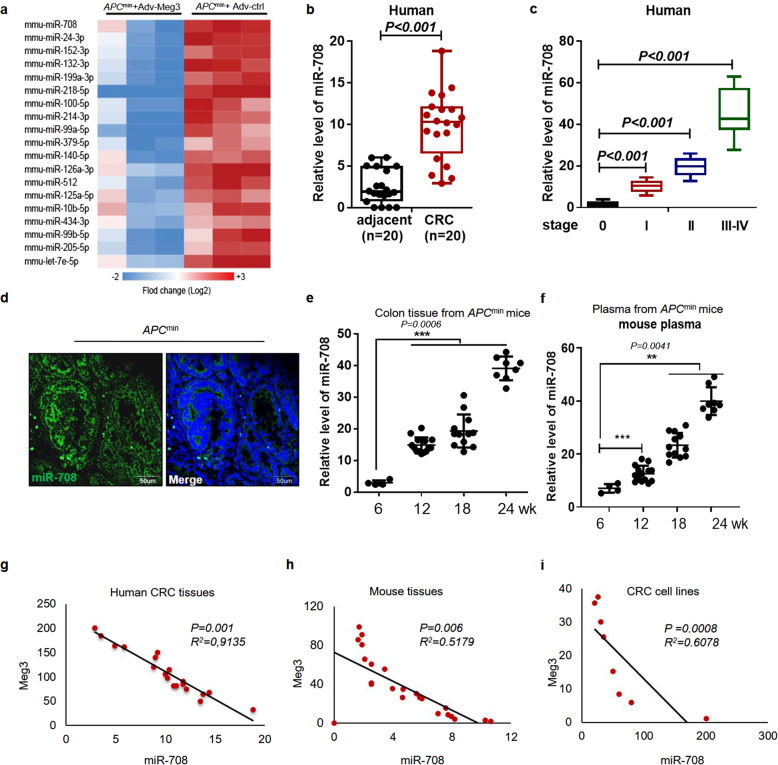
Fig. 1. The level of Meg3 negatively correlates with that of miR-708 in colonic tumorigenesis.
a A heat map showing miRs with significant accumulation (fold change > 2, p < 0.05) in colonic crypts from Apcmin mice (12 weeks old) administered (rectal instillation) with the Meg3-overexpressing adenovirus (Adv-Meg3) or control adenovirus (Adv-ctrl). b The relative expression of miR-708 in 20 pairs of CRC samples and adjacent normal samples by qPCR analyses. c The relative expression of miR-708 in tissues with different disease stages of CRC from TCGA dataset. d RNA-FISH assay was performed to detect the level and location of miR-708 in colonic adenoma from Apcmin mouse (22 weeks old). e, f The relative expression of miR-708 in colonic tissues (e) and plasma (f) from Apcmin mice of the indicated ages. g–i Plots showing the correlation between miR-708 and Meg3 levels in human CRC tissues (g), Apcmin mouse colonic tissues (h), and CRC cell lines (i). The results are presented as the mean ± S.D. in panels (b, c, e, f). **p < 0.01, ***p < 0.001 (non-paired two-tailed Student’s t test).

