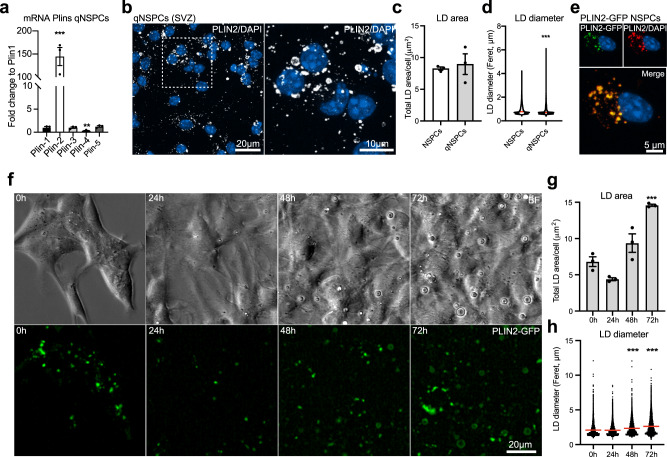
Fig. 2. LD accumulation changes significantly with quiescence.
a Analysis of mRNA expression by qRT-PCR shows that Plin2 is the most abundant Plin family member in quiescent SVZ NSPCs (n = 3 samples, fold change versus Plin1 ± SEM, one-way ANOVA with Dunnett’s multiple comparisons correction, adj. p-values: Plin2 < 0.0001, Plin4 = 0.0045). b Staining against PLIN2 (white) show that quiescent SVZ NSPCs also accumulate LDs, some of which have a larger size. Representative images are maximum intensity projections. Results were similar among 30 images from 3 coverslips per condition. DAPI-positive nuclei (blue). c The total LD accumulation did not significantly differ between proliferating and quiescent NSPCs (n = 378 proliferating cells, n = 567 quiescent cells from 3 coverslips per condition, mean ± SEM, Mann–Whitney test, two-tailed, p = 0.7). d Measurements of the diameter of LDs in proliferating and quiescent NSPCs revealed a significant increase in the proportion of large LDs with quiescence. Shown are violin plots depicting all LD diameters in the two conditions (Mann–Whitney test, two-tailed, p < 0.0001). e Stable overexpression of the Plin2-Gfp construct in NSPCs leads to GFP-positive LDs, as shown with PLIN2 co-staining. Representative images are maximum intensity projections. DAPI-positive nuclei (blue). Results were similar among 3 coverslips. f Time-lapse analysis of PLIN2-GFP NSPCs during quiescence induction. Representative brightfield (upper panel) and fluorescent images (lower panel) at 0, 24, 48 and 72 h after quiescence induction. Results were similar among 9 large fields of view from 3 wells. g Quantification of LDs over time revealed a significant increase in the number of LDs in quiescent NSPCs. (n = 3 wells, mean ± SEM, one-way ANOVA, Tukey’s multiple comparisons test, adj. p-value: 0 h vs. 72 h = 0.0003). h LD diameters were also significantly increased when full quiescence was reached. Violin plots depict all LD diameters at the timepoints analysed (one-way ANOVA, Tukey’s multiple comparisons test, adj. p-values: 0 h vs. 48 h < 0.0001; 0 h vs. 72 h < 0.0001). Asterisks indicate the following p-values: *** < 0.001.

