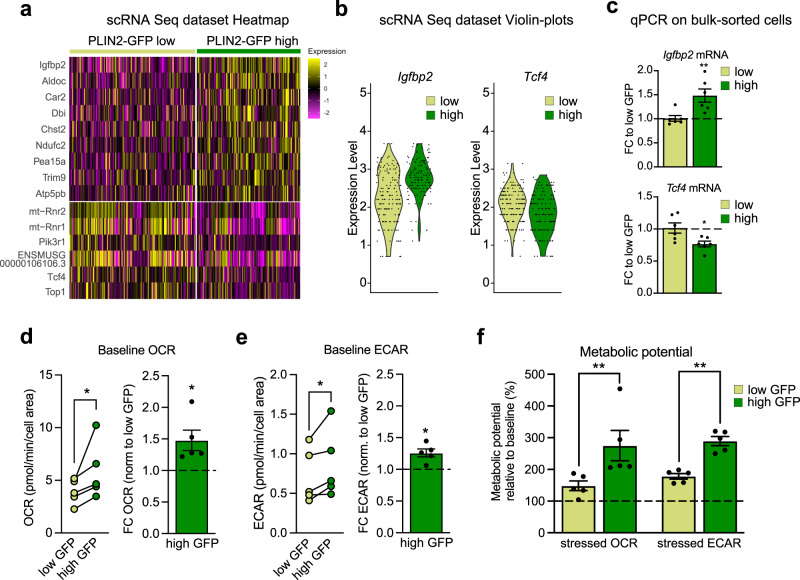
Fig. 5. Single-cell gene expression analyses and functional metabolic measurements reveal differences between low and high LD-containing NSPCs.
a scRNA-Seq analysis of low and high LD-containing NSPCs shows few differentially expressed genes. Heatmap of the significantly changed genes (Wilcoxon Rank Sum test, Bonferroni corrected for multiple testing, adj. p-value < 0.1). b Igfbp2 and Tcf4 are among the significantly altered genes. Igfbp2 is upregulated in high PLIN2-GFP NSPCs whereas Tcf4 is downregulated. Violin plots of the scRNA-Seq dataset. c These changes are validated by qRT-PCR on bulk sorted low and high PLIN2-GFP cells (n = 6 sorted samples per condition from 2 independent experiments, mean fold change compared to low PLIN2-GFP ± SEM, unpaired t-test, two-tailed, p-value = 0.0053 Igfbp2; p-value = 0.0202 Tcf4). d Metabolic measurements of oxygen consumption rate (OCR) shows an increase in baseline OCR in high PLIN2-GFP NSPCs compared to low PLIN2-GFP NSPCs. The left graph shows individual OCR measures per experiment. The lines link low and high PLIN2-GFP samples from the same experiments. The right graph show the FC in OCR normalized to low PLIN2-GFP per experiment (n = 5 independent experiments shown as dots, bars indicate the mean value ± SEM, one-sample t-test on log2-transformed FC-values, two-tailed, p-value = 0.0208). e Metabolic measurements of the extracellular acidification rate (ECAR) shows an increase in baseline ECAR in high PLIN2-GFP NSPCs compared to low PLIN2-GFP NSPCs. The left graph show individual ECAR measures per experiment. The lines link low and high PLIN2-GFP samples from the same experiments. The right graph shows the FC in ECAR normalized to low PLIN2-GFP per experiment (n = 5 independent experiments, shown as dots, bars indicate the mean value ± SEM, one-sample t-test on log2-transformed FC-values, two-tailed, p-value = 0.0112). f Metabolic potential relative to baseline after inhibition of ATP synthase and removal of the proton gradient. The metabolic potential for OCR and ECAR is significantly increased in high PLIN2-GFP NSPCs compared to low PLIN2-GFP NSPCs (n = 5 independent experiments shown as dots, bars indicate the mean value ± SEM, two-way ANOVA, Holm-Sidak multiple comparison corrections, adj. p-value OCR = 0.0076; adj. p-value ECAR = 0.009). Asterisks indicate the following p-value: * < 0.05. ** < 0.01.

