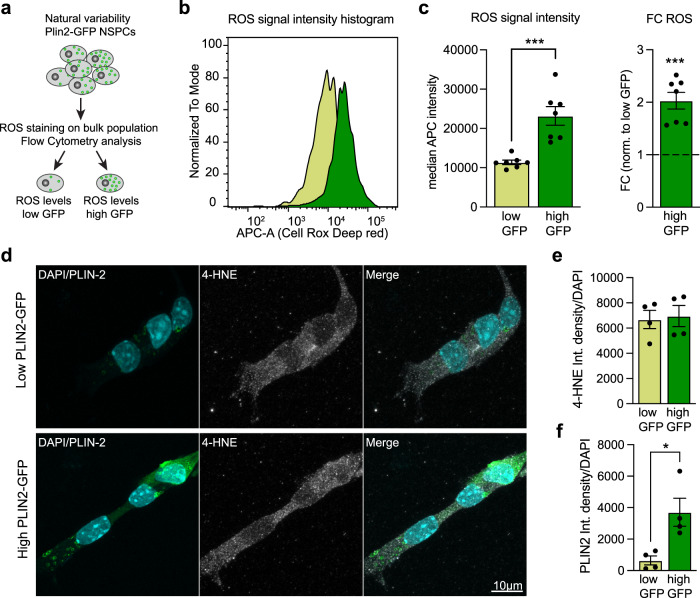
Fig. 6. Higher ROS levels in the high LD-containing NSPCs do not lead to increased lipid peroxidation.
a Schematic representation of the experiment to determine ROS levels. b ROS signal intensity histogram showing a clear difference between low and high PLIN2-GFP NSPCs. c Quantification of the median ROS intensity reveals that high PLIN2-GFP NSPCs have significantly higher ROS levels than low PLIN2-GFP NSPCs. Individual values (left panel) and fold change (right panel) normalized to the low PLIN2-GFP NSPCs are shown (n = 7 individual samples shown as dots, from 3 independent experiments, bars indicate the mean value ± SEM, raw values: Mann–Whitney test, two-tailed, p-value = 0.0006, FC-values: one-sample t-test on log2-transformed FC-values, two-tailed, p-value = 0.0001). d Staining against 4-HNE (white) shows no difference in this lipid peroxidation marker between proliferating low and high PLIN2-GFP NSPCs. Representative images are maximum intensity projections. e Quantification of the 4-HNE intensity per cell confirms that there are no differences (unpaired t-test, two-tailed, p-value = 0.8149) in the levels of 4-HNE between the two populations (n = 4 coverslips, from 2 independent experiments with a total of 126 high and 148 low PLIN2-GFP cells analyzed, bars indicate the mean value ± SEM). f Quantification of the PLIN2 intensity per cell confirms that the high PLIN2-GFP NSPCs have more LDs than the low PLIN2-GFP NSPCs (n = 4 coverslips, from 2 independent experiments with a total of 126 high and 148 low PLIN2-GFP cells analyzed, bars indicate the mean value ± SEM, unpaired t-test, two-tailed, p-value = 0.0167). Asterisks indicate the following p-value: * < 0.05. ** < 0.01. *** < 0.001.

