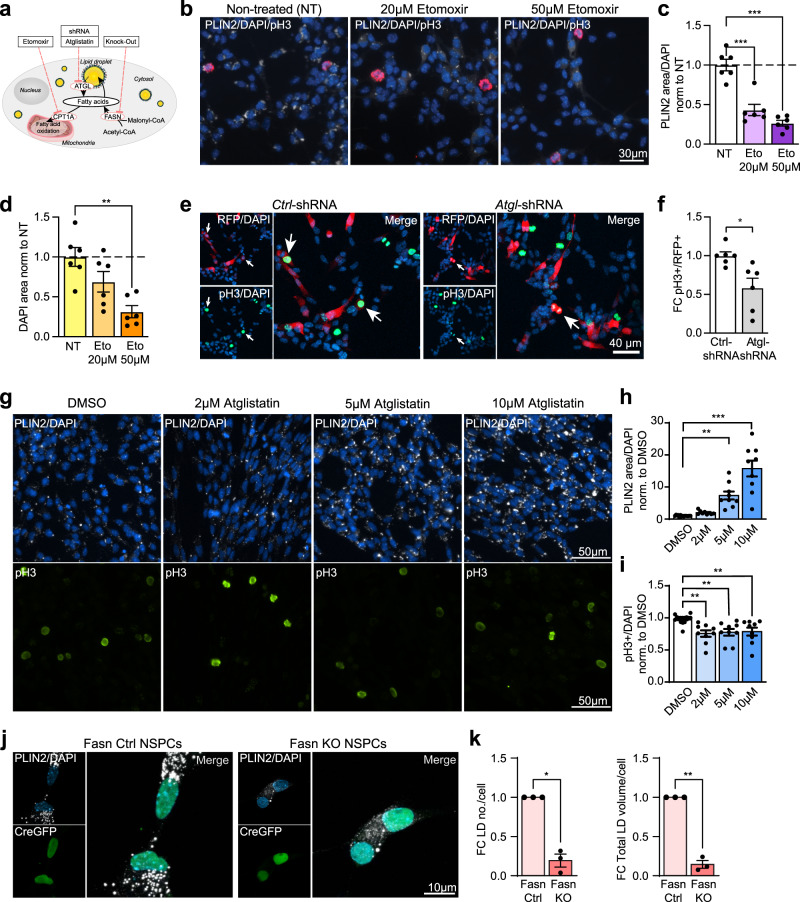
Fig. 7. Manipulating the build-up or breakdown of LDs decreases NSPC proliferation.
a Scheme illustrating the different manipulations. Carnitine palmitoyl transferase 1 (CPT1A), adipose triglyceride lipase (ATGL), fatty acid synthase (FASN). b Representative images of proliferating (pH3, red) NSPCs treated with Etomoxir. PLIN2 (white),DAPI (blue). Results were similar among 6 coverslips. c PLIN2 area covered, normalized to cell numbers, decreases with Etomoxir (n = 6 coverslips shown as dots, from 3 independent experiments, bars indicate the mean value ± SEM, one-way ANOVA, Holm-Sidak correction, p-value < 0.0001 for 20 and 50 μM Etomoxir). d The total DAPI area covered significantly decreased with Etomoxir (n = 6 coverslips shown as dots, from 3 independent experiments, bars indicate the mean value ± SEM, one-way ANOVA, Holm-Sidak correction, p-value = 0.066 for 20 μM and 0.0015 for 50 μM Etomoxir). e Representative images are maximum intensity projections of Ctrl-shRNA and Atgl-shRNA transfected proliferating NSPCs. DAPI (blue). Arrows indicate pH3+/RFP+cells. Results were similar among 6 coverslips per condition. f Atgl knockdown leads to a significant reduction in proliferating (pH3+) NSPCs compared to Ctrl-shRNA transfected NSPCs. (n = 6 coverslips from 2 independent experiments, bars indicate the mean ± SEM, unpaired t-test, two-tailed, p-value = 0.0113). g Representative images of proliferating NSPCs treated with Atglistatin. PLIN2 (white), pH3 (green), DAPI (blue). h PLIN2 area covered, normalized to cell numbers, significantly increases with Atglistatin (n = 9 coverslips shown as dots, from 3 independent experiments, bars indicate the mean ± SEM, one-way ANOVA, Holm-Sidak correction, p-value = 0.0018 for 5 μM and <0.0001 for 10 μM Atglistatin). i Proliferating pH3-positive NSPCs significantly decrease with Atglistatin (n = 9 coverslips shown as dots, from 3 independent experiments, bars indicate the mean ± SEM, one-way ANOVA, Holm-Sidak correction, p-value = 0.0022 for 2 μM, 0.0059 for 5 μM and 0.0094 for 10 μM Atglistatin). j PLIN2 (white) is reduced in Fasn KO NSPCs (positive for Cre-GFP, green) compared to Fasn Ctrl NSPCs. Representative images are maximum intensity projections. DAPI-positive nuclei (blue). k LD numbers and total LD volume significantly decrease in Fasn KO NSPCs (n = 3 coverslips, from 3 independent experiments with a total of 68 Fasn KO and 50 Fasn Ctrl cells analyzed, bars indicate the mean ± SEM, one-sample t-test on log2-transformed FC-values, two-tailed, p-value = 0.0972 and 0.026). Asterisks indicate the following p-value: + = 0.097. * < 0.05. ** < 0.01. *** < 0.001.

