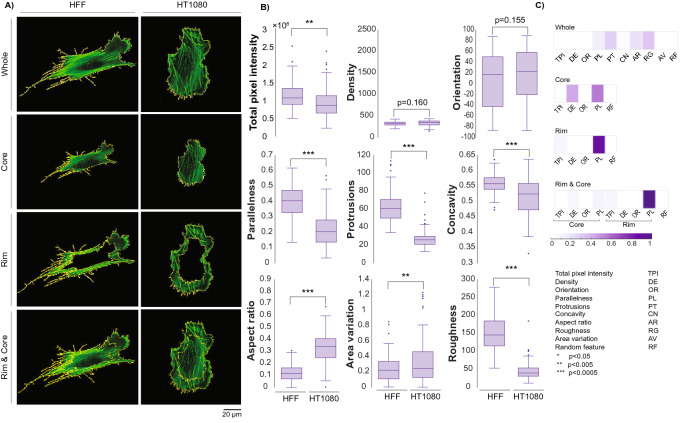
Figure 2.
(A) Single HFF-1 and HT-1080 cells are segmented based on defined localization classes. (B) Features were extracted from the entire data set of HFF-1 s and HT-1080 s images (whole cell, ~ 100 cells per line). Differences between these classes can be observed by eye and by statistically significant differences in features summarizing morphological and organizational properties. (C) Fisher discriminant analysis identified the most discriminatory features between these two data sets for all four localization classes.

