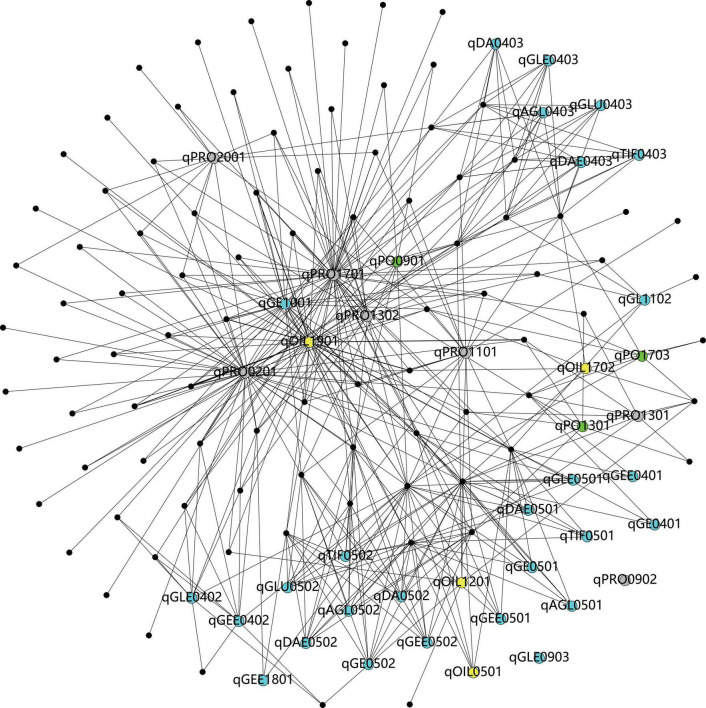
FIGURE 6.
The visualization of correlations between pathways and quantitative trait locus (QTL) (the black dots refer to pathways, the blue dots refer to the QTL associated with isoflavones, the gray dots present the QTL linked with protein, the yellow dots mean the QTL related to oil, and the green dots present to the QTL associated with protein plus oil).

