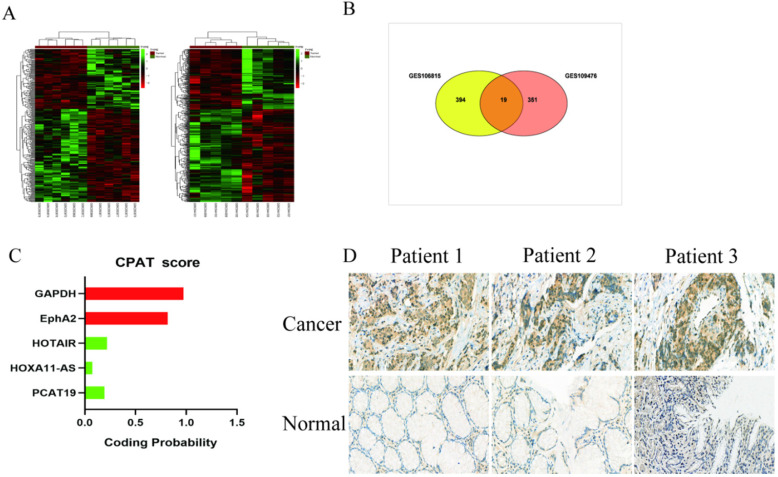
Figure 1.
Expression profile of lnRNA in GC. A. Hierarchical clustering analysis of lncRNAs that were differentially expressed (fold change > 2; P < 0.05). B. Overlap of misregulated lncRNAs in GSE106815 and GSE109476 datasets. C. CPAT analyses of the protein-coding potential of PCAT19. D. In situ hybridization to detect PCAT19 expression in GC tissues and adjacent non-tumor tissues.

