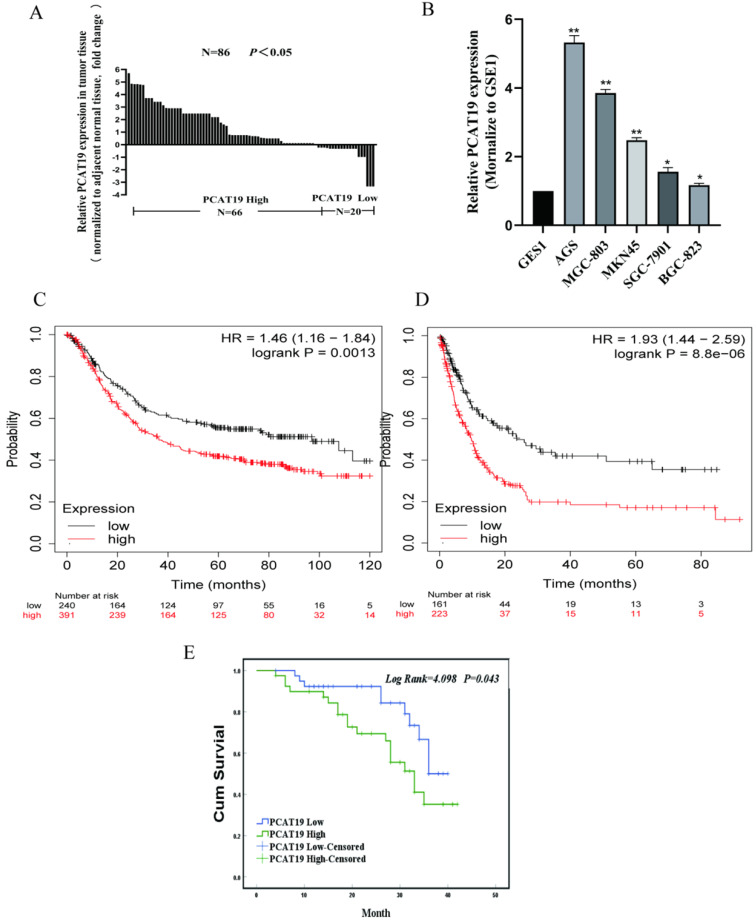
Figure 2.
Overexpression of LncRNA PCAT19 in GC and correlation with poor prognosis of GC patients. A. Expression of PCAT19 in GC tissues from TCGA database. B. Relative PCAT19 expression in GC analyzed by qRT-PCR. C. PCAT19 expression levels of GC cell lines and normal GES-1 gastric epithelium cell line by qRT-PCR. D. Kaplan-Meier analysis of OS in 86 GC patients. E and F. Kaplan-Meier Survival Plots (K-M plots) analysis of OS and disease-free survival (DFS) of GC patients based on PCAT19 expression.

