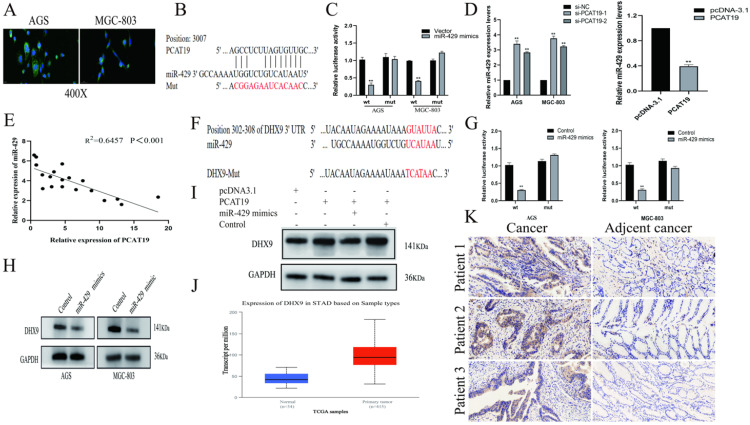
Figure 5.
PCAT19 bond to miR-429 as a sponge and regulation of DHX9 expression. A. Use of FISH to detect PCAT19 location in AGS and MGC803 cells (green = PCAT19; blue = DAPI). B. Potential binding sites between PCAT19 and miR-429. C. Dual-luciferase assay to verify the binding of miR-429 to PCAT19. D. Expression level of miR-429 detected by real-time PCR after PCAT19 overexpression or knockdown. E. Negative correlation between PCAT19 and miR-429 expression in GC tissues. F. Prediction of miR-429 binding sites on 3-UTR of DHX9. G. Dual-luciferase assay that confirms the binding of miR-429 to DHX9 3-UTR. H. Expression level of DHX9 in AGS and MGC-803 cells after transfection of miR-429 mimics. I. Expression level of DHX9 after ectopic expression of PCAT19 or/and miR-429. J. Expression of DHX9 in GC tissues from the TCGA database. K. Expression of DHX9 determined by IHC. *P < 0.05, **P < 0.01.

