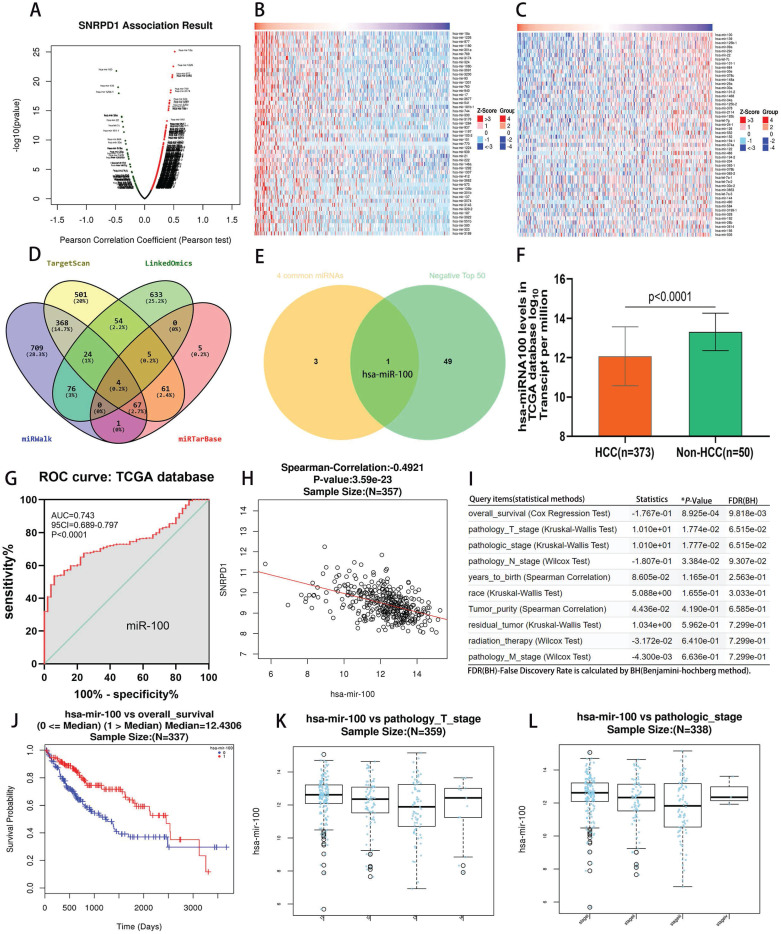
Figure 5.
Analysis of association between miRNAs and SNRPD1 expression in the TCGA database. (A-C) SNRPD1 expression associated miRNAs analysis in the LinkedOmics database. (A) Volcano chart exhibited SNRPD1 expression positively/negatively correlated significant miRNAs. (B) The top 50 miRNAs that are positively associated with SNRPD1 expression. (C) The top 50 miRNAs that are negatively associated with SNRPD1 expression. (D) 4 overlapping miRNAs interact with SNRPD1 obtained from the “LinkedOmics”, “miRWalk”, “TargetScan”, and “miRTarBase” databases. (E) The Venny diagram exhibited that hsa-miR-100 overlapping in “4 Common miRNAs” and “SNRPD1 Negatively Correlated Significant miRNAs (top 50)”. (F) The expression of miR-100 in HCC tissues (n=373) was significantly lower than that in non-HCC tissues (n=50) in the TCGA database. (G) The receiver operating characteristic (ROC) curve revealed that miR-100 expression has a significant diagnosis value on HCC (AUC=0.743, P<0.0001). (H) Scatter plot visualizing that hsa-mir-100 negatively significantly correlated with SNRPD1 expression in the HCC patients (Spearman-correlation: -0.4921, P=3.59e-23). (I) Association of miR-100 expression with clinicopathologic outcomes in HCC patients in the LinkedOmics database. (J) The survival analysis showed that low hsa-miR-100 mRNA expression were significantly associated with the poor overall survival in HCC patients (P=8.925e-04). (K) Hsa-miR-100 expression was correlated with pathology_T_stage (P = 1.774E-02). (L) Hsa-miR-100 expression was correlated with pathologic_stage (P = 1.777E-02).

